In this tutorial, we’ll explain the steps to Install Nagiosgraph for Nagios Core on CentOS 7. Nagiosgraph plugin adds another feature to Nagios core for displaying historical graphs.
Nagiosgraph generates HTML pages and creates graphs with graphical reports from the data which is collected by Nagios and store data in RRD (Round Robin Data) files. In this tutorial, we will install Nagiosgraph on a pre-installed Nagios Core server on Centos 7.
Prerequisite list:
- Installed NagiOS core on CentOS 7
- You need sudo/root privilege with ssh login
Steps to Install Nagiosgraph for Nagios Core on CentOS 7
Step 1: Install prerequisite packages
$ yum -y install perl-GD php-gd rrdtool-perl rrdtool-php rrdtool perl-CGI perl-Time-HiRes
Step 2: Download Nagiosgraph plugin
$ cd /usr/src/

$ wget https://sourceforge.net/projects/nagiosgraph/files/nagiosgraph/1.5.2/nagiosgraph-1.5.2.tar.gz
You can check the latest Nagiosgraph version from official page.
Step 3: Extract Nagiosgraph tar file
$ cd /usr/src/

$ tar xvf nagiosgraph-1.5.2.tar.gz
Step 4: Check the prerequisite package available for Nagiosgraph
$ cd /usr/src/nagiosgraph-1.5.2

$ ./install.pl --check-prereq
Demo output:
[root@CentOS-7 nagiosgraph-1.5.2]# ./install.pl --check-prereq

checking required PERL modules

  Carp...1.26

  CGI...3.63

  Data::Dumper...2.145

  Digest::MD5...2.52

  File::Basename...2.84

  File::Find...1.20

  MIME::Base64...3.13

  POSIX...1.30

  RRDs...1.4008

  Time::HiRes...1.9725

checking optional PERL modules

  GD...2.49

  Nagios::Config... ***FAIL***

checking nagios installation

  found nagios exectuable at /usr/local/nagios/bin/nagios

checking web server installation

  found apache executable at /usr/sbin/httpd

[root@CentOS-7 nagiosgraph-1.5.2]#
Step 5: Install nagiosgraph plugin
$ ./install.pl --layout overlay --prefix /usr/local/nagios
During installation set the appropriate path, so that most of the config is auto made by Nagiosgraph.
[root@CentOS-7 nagiosgraph-1.5.2]# ./install.pl --layout overlay --prefix /usr/local/nagios

checking required PERL modules

  Carp...1.26

  CGI...3.63

  Data::Dumper...2.145

  Digest::MD5...2.52

  File::Basename...2.84

  File::Find...1.20

  MIME::Base64...3.13

  POSIX...1.30

  RRDs...1.4008

  Time::HiRes...1.9725

checking optional PERL modules

  GD...2.49

  Nagios::Config... ***FAIL***

checking nagios installation

  found nagios exectuable at /usr/local/nagios/bin/nagios

checking web server installation

  found apache executable at /usr/sbin/httpd

Destination directory (prefix)? [/usr/local/nagios]

Location of configuration files (etc-dir)? [/usr/local/nagios/etc/nagiosgraph]

Location of executables? [/usr/local/nagios/libexec]

Location of CGI scripts? [/usr/local/nagios/sbin]

Location of documentation (doc-dir)? [/usr/local/nagios/docs/nagiosgraph]

Location of examples? [/usr/local/nagios/docs/nagiosgraph/examples]

Location of CSS and JavaScript files? [/usr/local/nagios/share]

Location of utilities? [/usr/local/nagios/docs/nagiosgraph/util]

Location of state files (var-dir)? [/var/nagios] /usr/local/nagios/var

Location of RRD files? [/usr/local/nagios/var/rrd]

Location of log files (log-dir)? [/var/nagios] /usr/local/nagios/var

Path of log file? [/usr/local/nagios/var/nagiosgraph.log]

Path of CGI log file? [/usr/local/nagios/var/nagiosgraph-cgi.log]

Base URL? [/nagios]

URL of CGI scripts? [/nagios/cgi-bin]

URL of CSS file? [/nagios/nagiosgraph.css]

URL of JavaScript file? [/nagios/nagiosgraph.js]

URL of Nagios CGI scripts? [/nagios/cgi-bin]

Path of Nagios performance data file? [/tmp/perfdata.log] /usr/local/nagios/var/service-perfdata.log

username or userid of Nagios user? [nagios]

username or userid of web server user? [apache]

...
Take the backup of nagios.cfg file before making the changes
$ cp -p /usr/local/nagios/etc/nagios.cfg /usr/local/nagios/etc/nagios.cfg.`date -I`
Disable all performance related parameter from file “/usr/local/nagios/etc/nagios.cfg”
Add below lines in nagios.cfg file, this will enable Nagios to keep a history of performance data.
# process nagios performance data using nagiosgraph

process_performance_data=1

service_perfdata_file=/usr/local/nagios/var/service-perfdata.log

service_perfdata_file_template=$LASTSERVICECHECK$||$HOSTNAME$||$SERVICEDESC$||$SERVICEOUTPUT$||$SERVICEPERFDATA$

service_perfdata_file_mode=a

service_perfdata_file_processing_interval=30

service_perfdata_file_processing_command=process-service-perfdata-for-nagiosgraph
Step 6: Enable storage of performance metrics
Add below lines in “/usr/local/nagios/etc/objects/commands.cfg” file
define command {

  command_name process-service-perfdata-for-nagiosgraph

  command_line /usr/local/nagios/libexec/insert.pl

}
Step 7: Now test/verify the Nagios configuration.
$ /usr/local/nagios/bin/nagios -v /usr/local/nagios/etc/nagios.cfg
Demo output:
[root@CentOS-7 nagiosgraph-1.5.2]# /usr/local/nagios/bin/nagios -v /usr/local/nagios/etc/nagios.cfg

Nagios Core 4.4.5

Copyright (c) 2009-present Nagios Core Development Team and Community Contributors

Copyright (c) 1999-2009 Ethan Galstad

Last Modified: 2019-08-20

License: GPL


Website: https://www.nagios.org

Reading configuration data...

   Read main config file okay...

   Read object config files okay...


Running pre-flight check on configuration data...

Checking objects...

        Checked 8 services.

        Checked 1 hosts.

        Checked 1 host groups.

        Checked 0 service groups.

        Checked 1 contacts.

        Checked 1 contact groups.

        Checked 25 commands.

        Checked 5 time periods.

        Checked 0 host escalations.

        Checked 0 service escalations.

Checking for circular paths...

        Checked 1 hosts

        Checked 0 service dependencies

        Checked 0 host dependencies

        Checked 5 timeperiods

Checking global event handlers...

Checking obsessive compulsive processor commands...

Checking misc settings...


Total Warnings: 0

Total Errors:   0


Things look okay - No serious problems were detected during the pre-flight check
[root@CentOS-7 nagiosgraph-1.5.2]#
Step 8: Restart the service
$ systemctl restart nagios
Step 9: Verify Nagiosgraphs plugin is integrated with Nagios core
goto Nagios web UI follow below steps:
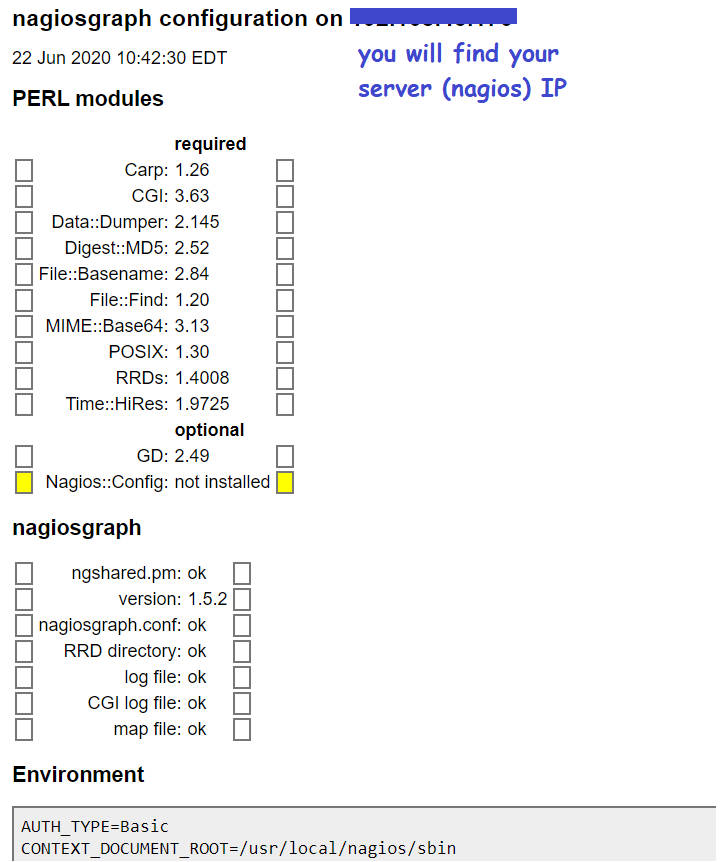
url : http://nagios-ip-address/nagios/cgi-bin/showconfig.cgi
Sample output:
Step 10: Define service in templates.cfg file
Add below line in file “/usr/local/nagios/etc/objects/templates.cfg” this will enable nagiosgraphs
define service {

      name              graphed-service

      action_url        /nagios/cgi-bin/show.cgi?host=$HOSTNAME$&service=$SERVICEDESC$' onMouseOver='showGraphPopup(this)' onMouseOut='hideGraphPopup()' rel='/nagiosgraph/cgi-bin/showgraph.cgi?host=$HOSTNAME$&service=$SERVICEDESC$&period=week&rrdopts=-w+450+-j

      register        0

      }
Now, we need to append service “graphed-service” in our host file for which we want to enable graphs.
In this example I have enabled to HTTP_Checks in hosts file: “/usr/local/nagios/etc/objects/localhost.cfg”
define service {

    use                     local-service,graphed-service           ; Name of service template to use

    host_name               localhost

    service_description     HTTP

    check_command           check_http

    notifications_enabled   0

}
Step 11: Restart the service:
$ systemctl restart nagios
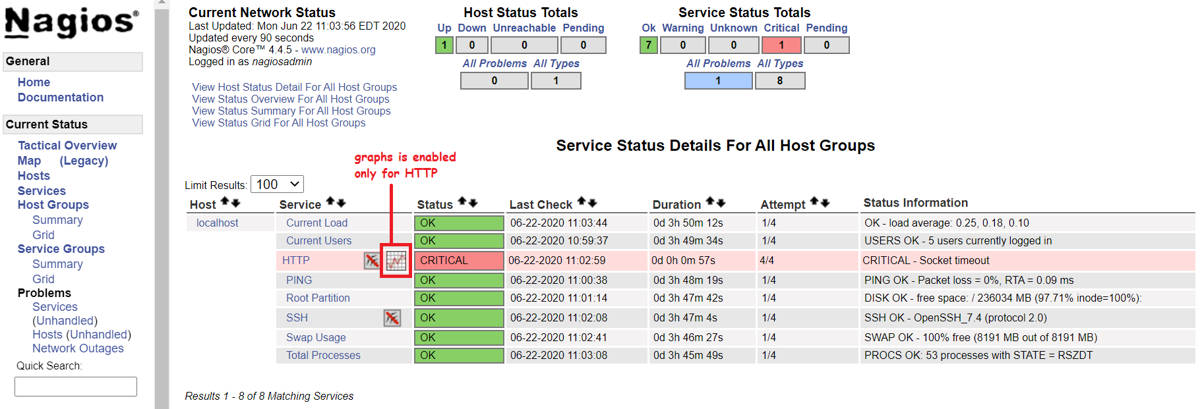
Sample Output:
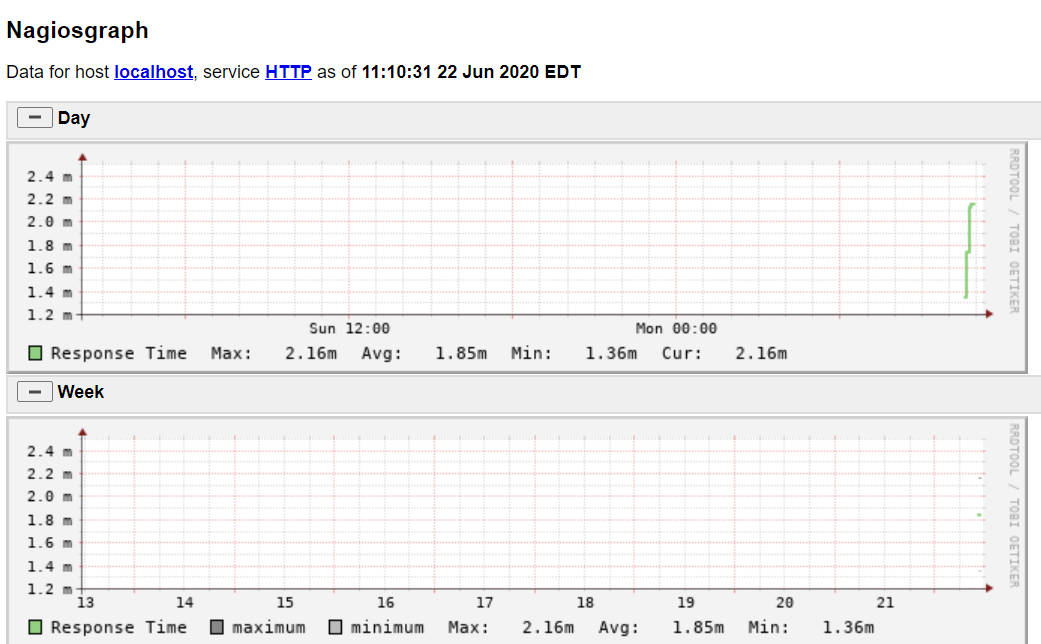
Explore graphs by clicking on graph icon, as shown below:
Like this you can enable all services for which you want graphs.
End of tutorial, you have learned all the steps to Install Nagiosgraph for Nagios Core on CentOS 7.


