In this article, you’ll see how to monitor Linux System with Grafana and Telegraf. Telegraf is a free open-source agent to collect metrics from your system (Linux/Windows performance metrics), DBs etc. InfluxDB will expose the data to the Grafana from the stored data. Grafana is a modern dashboarding solution. TIG stack (Telegraf InfluxDB Grafana)is the most popular and widely used nowadays for the modern monitoring tool.
Pre-requisites:
Make sure you have root or sudo privileges on your Linux system
In brief, Telegraf collects the metrics from your system, and it will be stored on InfluxDB, And then using Grafana we can visualize the data on a system dashboard.
Steps to Install InfluxDB on CentOS 7
Add InfluxDB yum repository
cat <<EOF | sudo tee /etc/yum.repos.d/influxdb.repo
[influxdb]
name = InfluxDB Repository - RHEL \$releasever
baseurl = https://repos.influxdata.com/rhel/\$releasever/\$basearch/stable
enabled = 1
gpgcheck = 1
gpgkey = https://repos.influxdata.com/influxdb.key
EOF
Update the YUM cache
sudo yum makecache fast
Install influxDB
sudo yum -y install influxdb vim curl
Start influxDB Service
sudo systemctl start influxdb
Enable the service to auto-start on boot
sudo systemctl enable influxdb
Configure InfluxDB firewall on CentOS
InfluxDB by default uses TCP 8086 and 8088 port.
– 8088 is used for backup and restore and also for RPC service.
– 8086 is used for communication between client-server over HTTP API
Open InfluxDB port in the firewall:
sudo firewall-cmd --add-port=8086/tcp --permanent
sudo firewall-cmd --reload
Path for InfluxDB config file: ” /etc/influxdb/influxdb.conf ”
Start the InfluxDB service to pick the updated configuration
sudo systemctl start influxdb && systemctl enable influxdb
InfluxDB http Authentication
$ sudo vim /etc/influxdb/influxdb.conf
[http]
auth-enabled = true
Create InfluxDB user and password
curl -XPOST "http://localhost:8086/query" --data-urlencode \
"q=CREATE USER testuser WITH PASSWORD 'yourstrongpassword' WITH ALL PRIVILEGES"
From the above command replace the username and password as mention below:
“testuser” change with your own username
“yourstrongpassword” change with your own password
Use username and password whenever you run influxDB command syntax:
$ influx -username 'username' -password 'password'
For curl command syntax:
curl -G http://localhost:8086/query -u username:password --data-urlencode "q=SHOW DATABASES"
Replace the username and password in the above command. If you didn’t get any database don’t worry once you configure telegraf, it will create DB as mention in telegraf.config file as mention below steps.
Sample Output:
[root@CentOS telegraf]# curl -G http://localhost:8086/query -u testuser:yourstrongpassword --data-urlencode "q=SHOW DATABASES"
{"results":[{"statement_id":0,"series":[{"name":"databases","columns":["name"],"values":[["_internal"],["telegraf-db"]]}]}]}
[root@CentOS telegraf]#
Steps to Install telegraf on CentOS 7
sudo yum -y install telegraf
[root@CentOS ~]# sudo yum -y install telegraf
Loaded plugins: fastestmirror, langpacks
Loading mirror speeds from cached hostfile
* base: mirrors.piconets.webwerks.in
* extras: ftp.cuhk.edu.hk
* updates: ftp.cuhk.edu.hk
Resolving Dependencies
--> Running transaction check
---> Package telegraf.x86_64 0:1.18.1-1 will be installed
--> Finished Dependency Resolution

Dependencies Resolved

=================================================================================================================================================
Package Arch Version Repository Size
=================================================================================================================================================
Installing:
telegraf x86_64 1.18.1-1 influxdb 24 M

Transaction Summary
=================================================================================================================================================
Install 1 Package

Total download size: 24 M
Installed size: 88 M
Downloading packages:
telegraf-1.18.1-1.x86_64.rpm | 24 MB 00:00:09
Running transaction check
Running transaction test
Transaction test succeeded
Running transaction
Installing : telegraf-1.18.1-1.x86_64 1/1
Created symlink from /etc/systemd/system/multi-user.target.wants/telegraf.service to /usr/lib/systemd/system/telegraf.service.
Verifying : telegraf-1.18.1-1.x86_64 1/1

Installed:
telegraf.x86_64 0:1.18.1-1

Complete!
[root@CentOS ~]#
Configure telegraf on CentOS 7
Sample configuration with basic input to collect system metrics and InfluxDB as an output.
Sample telegraf.conf
[global_tags]


# Configuration for telegraf agent
[agent]
interval = "10s"
debug = false
hostname = "CentOS-Server-01"
round_interval = true
flush_interval = "10s"
flush_jitter = "0s"
collection_jitter = "0s"
metric_batch_size = 1000
metric_buffer_limit = 10000
quiet = false
logfile = ""
omit_hostname = false

###############################################################################
# OUTPUTS #
###############################################################################

[[outputs.influxdb]]
urls = ["http://localhost:8086"]
database = "telegraf-db"
timeout = "0s"
username = "testuser"
password = "yourstrongpassword"
retention_policy = ""

###############################################################################
# INPUTS #
###############################################################################

[[inputs.cpu]]
percpu = true
totalcpu = true
collect_cpu_time = false
report_active = false
[[inputs.disk]]
ignore_fs = ["tmpfs", "devtmpfs", "devfs"]
[[inputs.io]]
[[inputs.mem]]
[[inputs.net]]
[[inputs.system]]
[[inputs.swap]]
[[inputs.netstat]]
[[inputs.processes]]
[[inputs.kernel]]
View the list of supported Telegraf input plugins
From the above sample telegraf.conf file you can change the below parameter as per your setup:
hostname: <provide hostname>
urls: Provide InfluxDB URL with port.
database name: with InfluxDB database name for this host
DB Username: provide InfluxDB username
DB password: provide InfluxDB password
Start and Enable the telegraf service:
sudo systemctl start telegraf && systemctl enable telegraf
This will automatically create the InfluxDB database if it doesn’t exist.
Steps to Install Grafana on CentOS 7
Add YUM repository to install Grafana
cat <<EOF | sudo tee /etc/yum.repos.d/grafana.repo
[grafana]
name=grafana
baseurl=https://packages.grafana.com/oss/rpm
repo_gpgcheck=1
enabled=1
gpgcheck=0
gpgkey=https://packages.grafana.com/gpg.key
sslverify=0
sslcacert=/etc/pki/tls/certs/ca-bundle.crt
EOF
Install Grafana:
sudo yum -y install grafana
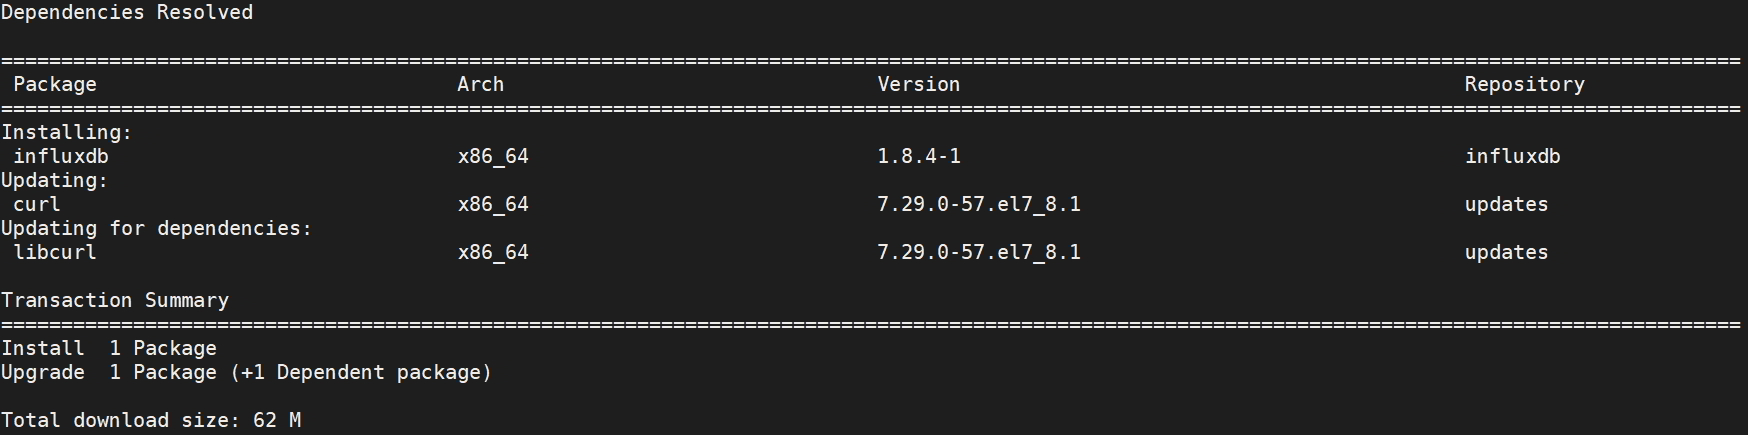
Sample Output:
[root@CentOS telegraf]# sudo yum -y install grafana
Loaded plugins: fastestmirror, langpacks
Loading mirror speeds from cached hostfile
* base: ftp.cuhk.edu.hk
* extras: ftp.cuhk.edu.hk
* updates: ftp.cuhk.edu.hk
base | 3.6 kB 00:00:00
extras | 2.9 kB 00:00:00
grafana/signature | 454 B 00:00:00
Retrieving key from https://packages.grafana.com/gpg.key
Importing GPG key 0x24098CB6:
Userid : "Grafana <info@grafana.com>"
Fingerprint: 4e40 ddf6 d76e 284a 4a67 80e4 8c8c 34c5 2409 8cb6
From : https://packages.grafana.com/gpg.key
grafana/signature | 3.0 kB 00:00:00 !!!
influxdb | 2.5 kB 00:00:00
updates | 2.9 kB 00:00:00
grafana/primary_db | 95 kB 00:00:01
Resolving Dependencies
--> Running transaction check
---> Package grafana.x86_64 0:7.5.3-1 will be installed
--> Finished Dependency Resolution

Dependencies Resolved

=================================================================================================================================================
Package Arch Version Repository Size
=================================================================================================================================================
Installing:
grafana x86_64 7.5.3-1 grafana 50 M

Transaction Summary
=================================================================================================================================================
Install 1 Package

Total download size: 50 M
Installed size: 169 M
Downloading packages:
grafana-7.5.3-1.x86_64.rpm | 50 MB 00:00:19
Running transaction check
Running transaction test
Transaction test succeeded
Running transaction
Installing : grafana-7.5.3-1.x86_64 1/1
### NOT starting on installation, please execute the following statements to configure grafana to start automatically using systemd
sudo /bin/systemctl daemon-reload
sudo /bin/systemctl enable grafana-server.service
### You can start grafana-server by executing
sudo /bin/systemctl start grafana-server.service
POSTTRANS: Running script
Verifying : grafana-7.5.3-1.x86_64 1/1

Installed:
grafana.x86_64 0:7.5.3-1

Complete!
[root@CentOS telegraf]#
Start and Enable Grafana Server:
sudo systemctl start grafana-server
sudo systemctl enable grafana-server
Default HTTP port is 3000
Default username: admin
Default password: admin
(After login Grafana will ask you to change the password.)
Default Grafana will log to /var/log/grafana
The default configuration file is /etc/grafana/grafana.
sqlite3 database store located at /var/lib/grafana/grafana.db
Configure firewall to open port for grafana
sudo firewall-cmd --add-port=3000/tcp --permanent
sudo firewall-cmd --reload
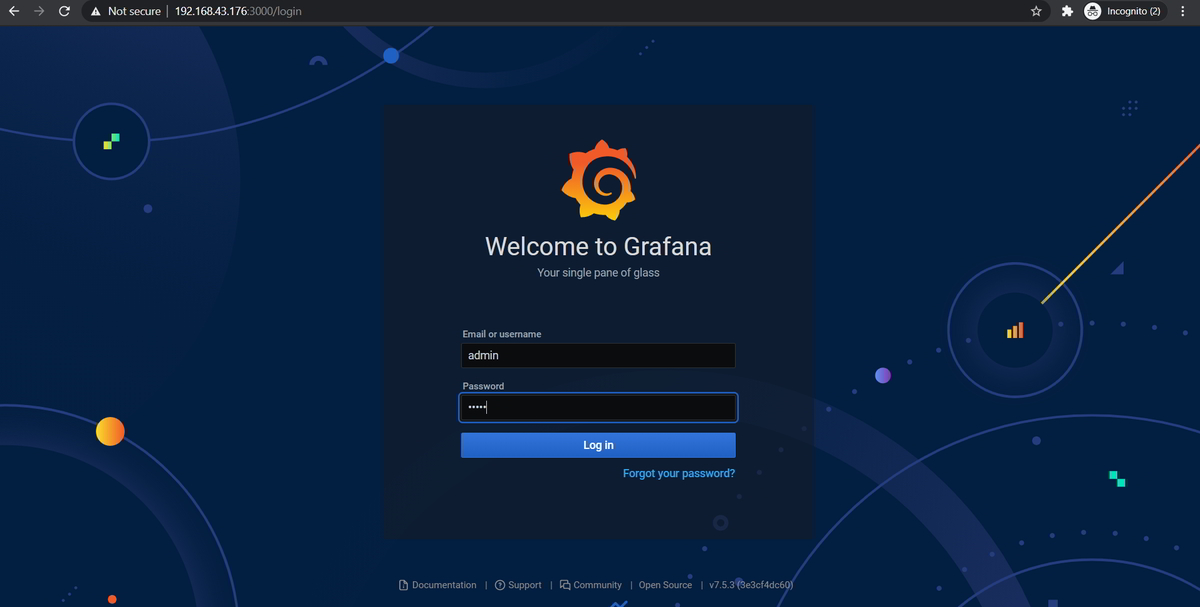
Access Grafana UI with your hostname/IP address of your host followed by port 3000
Grafana Login Page
Eg: http://<IP Address/host>:3000
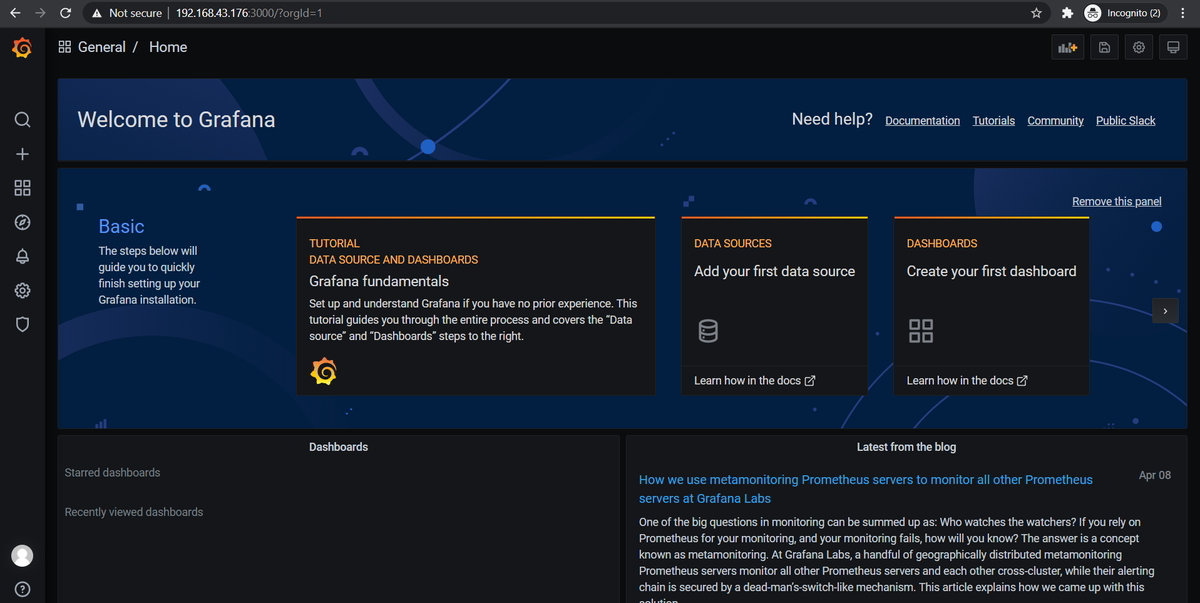
Grafana Home Page:
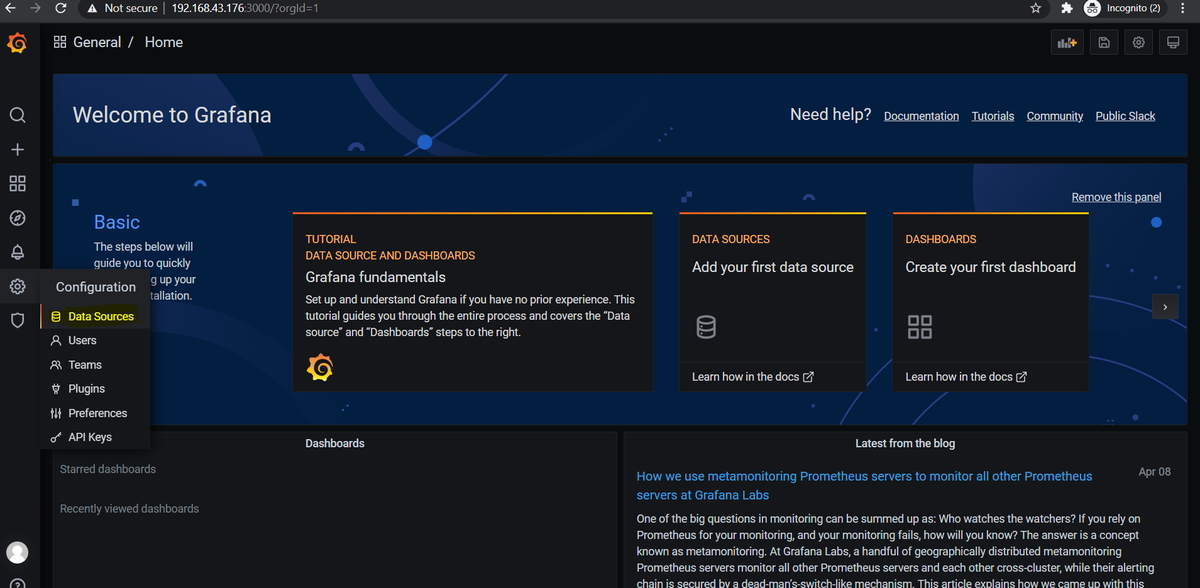
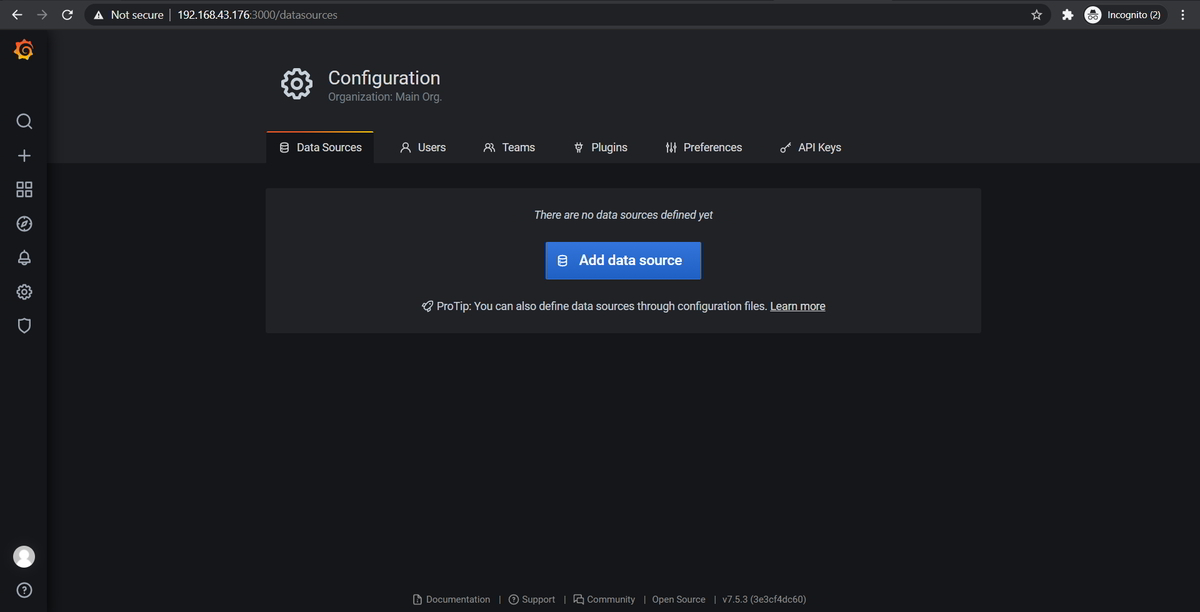
Configure InfluxDB in Grafana as a data source
Login with Grafana and navigate to Configuration > Data Sources > Add data source
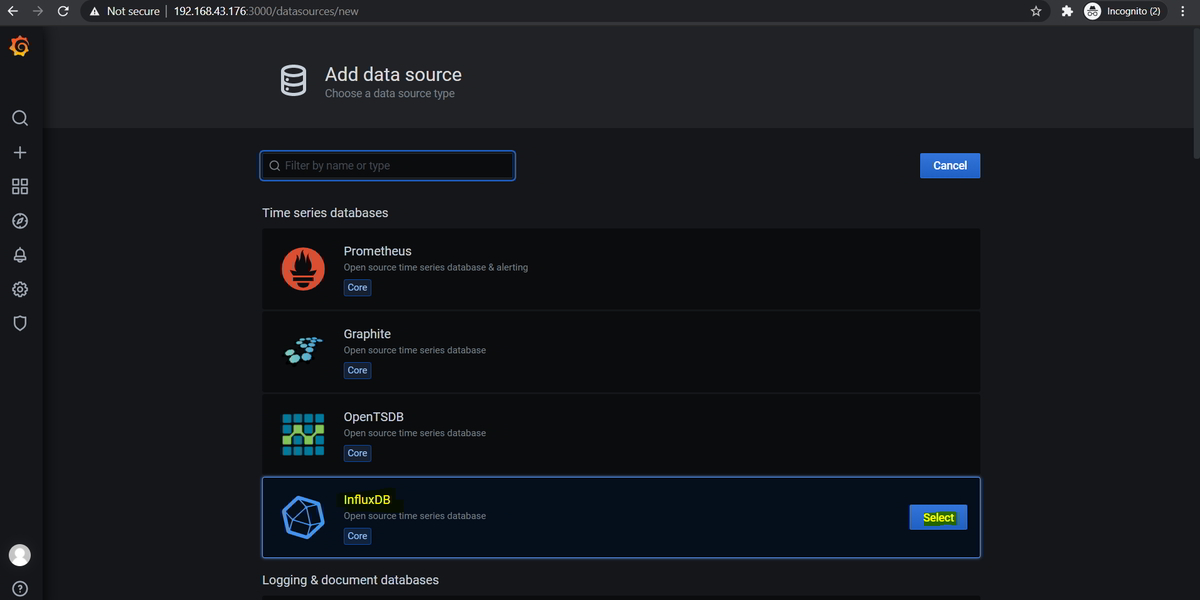
Select InfluxDB as a data source
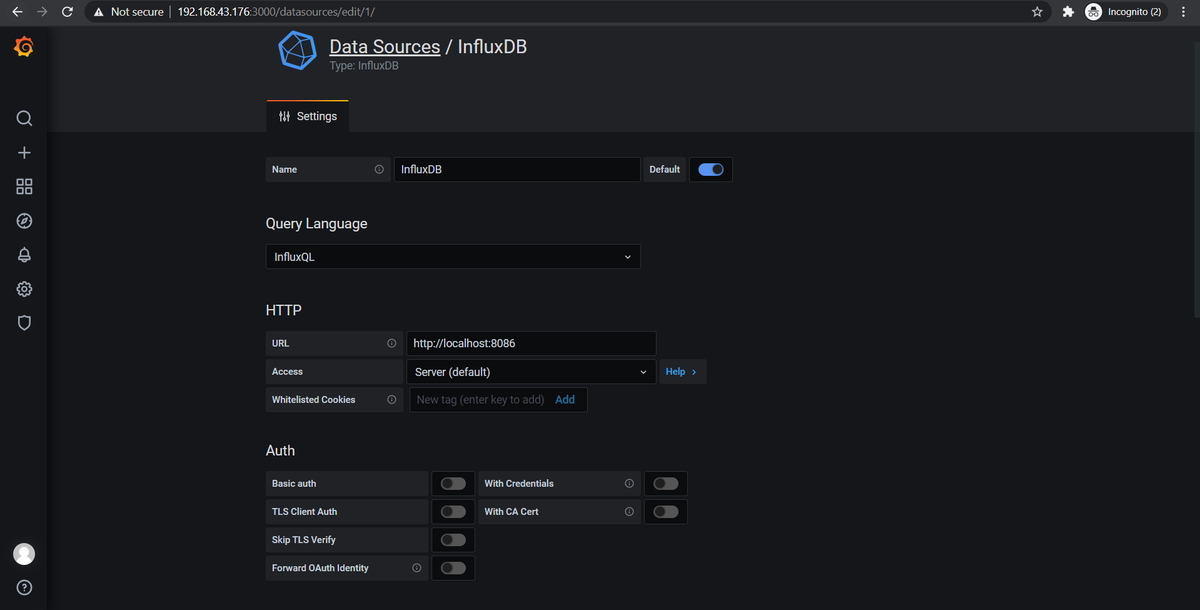
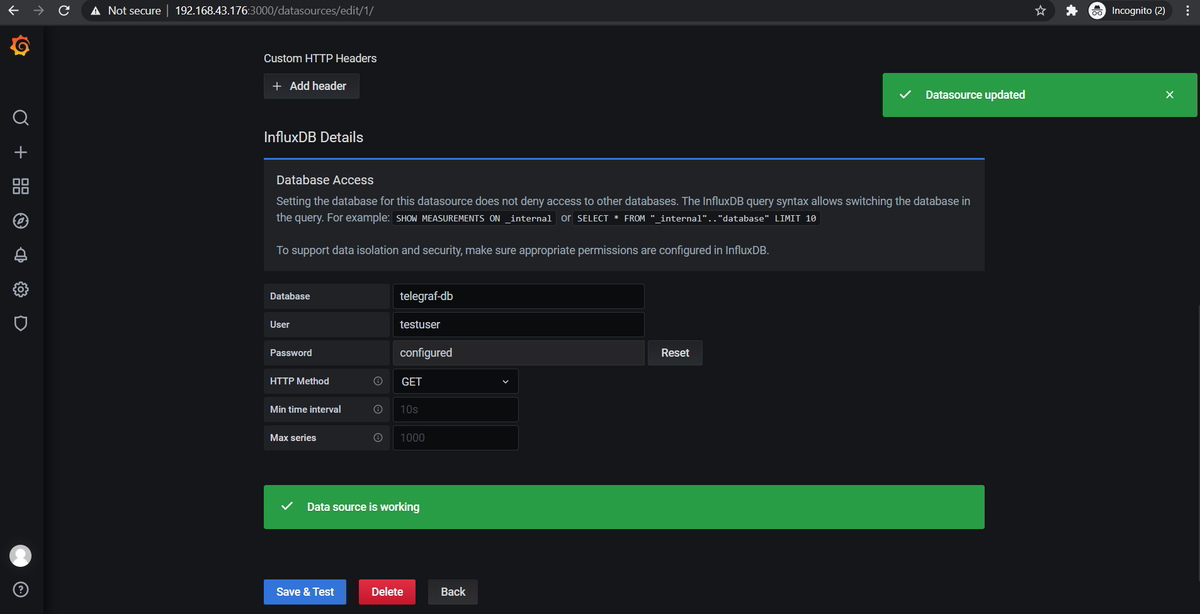
Provide the following details:
Name – influxdb
Type: InfluxDB
HTTP URL: InfluxDB Host/IP address with port 8086
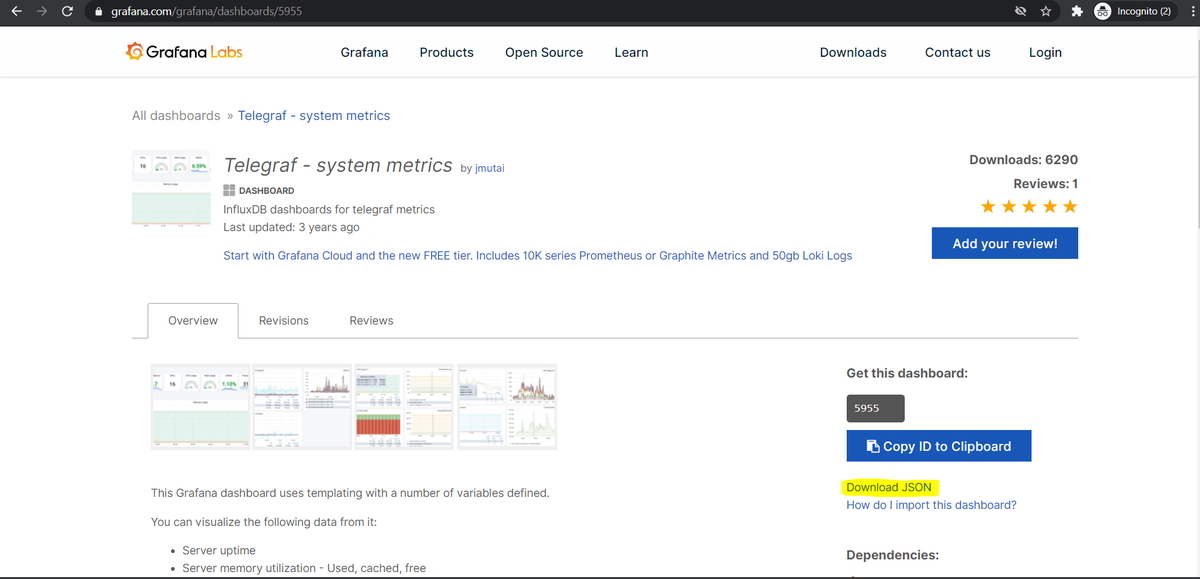
You can create a dashboard by importing a sample dashboard from the official Grafana page.
https://grafana.com/dashboards/5955 — Download the JSON file.
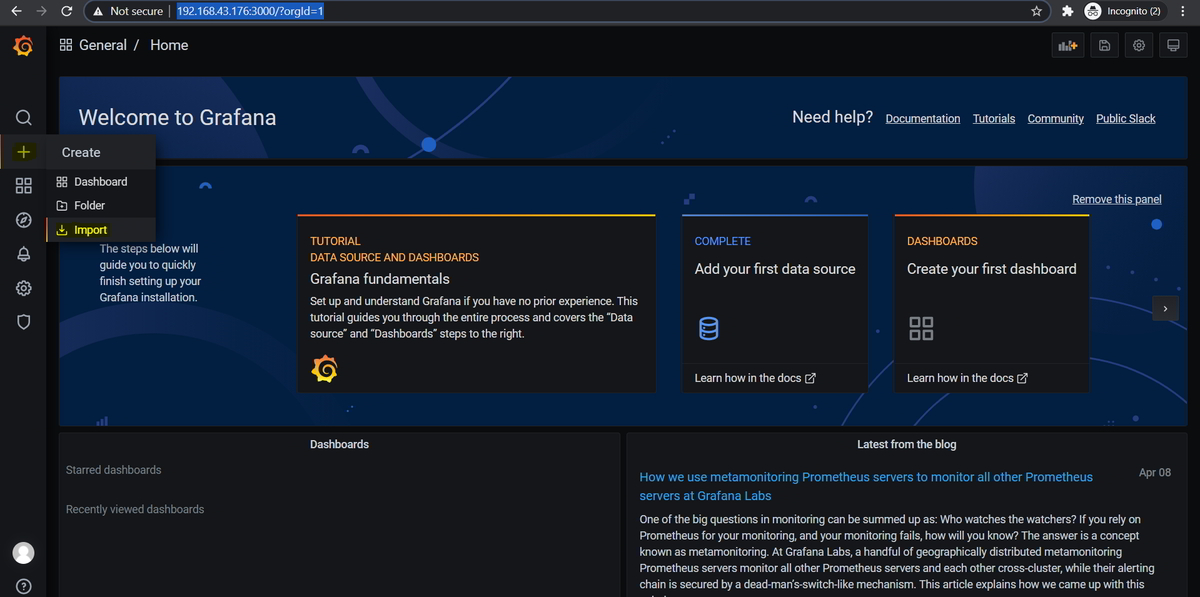
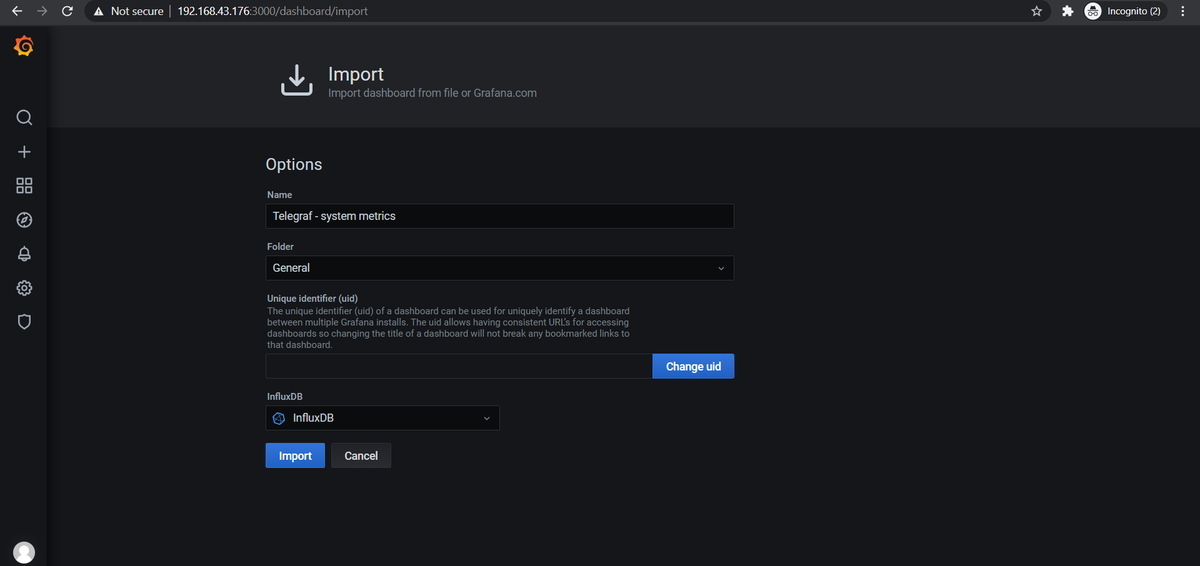
Goto your Grafana Web UI and Navigate to your Grafana > Import
Click on Upload .json file button and upload the downloaded file.
Metrics will be visualized as shown below.
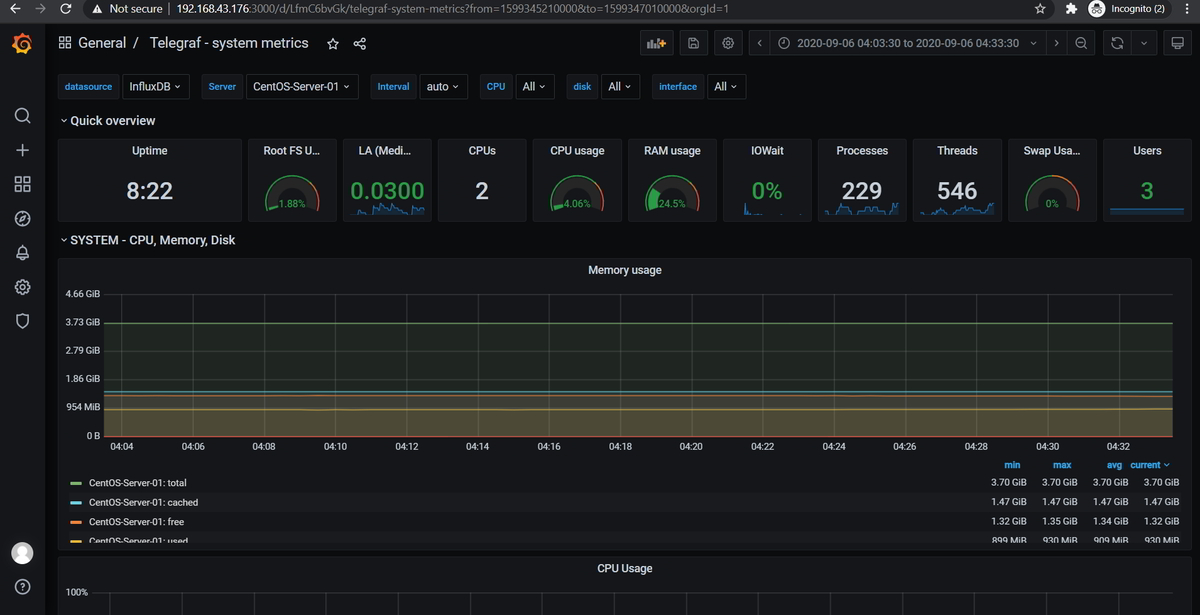
End of Article. You have successfully Monitor Linux System with Grafana and Telegraf.