In this topic, we will discuss ELK stack architecture Elasticsearch Logstash and Kibana. It is an open-source tool, it is used for log’s monitoring and analytics.
Elastic (ELK) Stack:
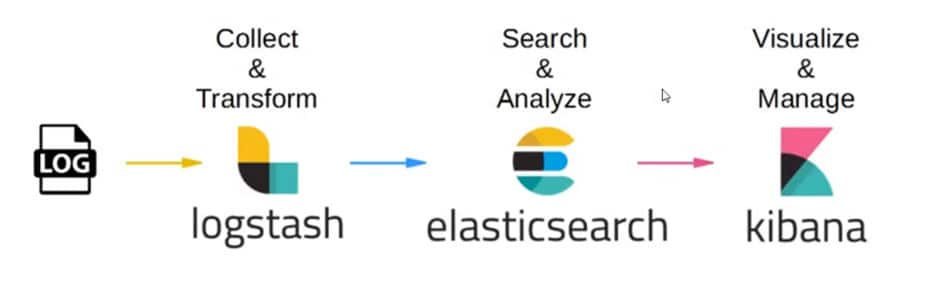
An elastic stack is a group of Open Source products from Elastic designed to help users to take data from any type of source and in any format and search, analyze and visualize that data in real-time. It uses Logstash for log aggregation, Elasticsearch for searching and Kibana for visualizing and analyzing data.
- ElasticSearch: (Database) Store, Search and Analyse
- Logstash: (Log collection engine) Collect Logs and events data, parse and Transform
- Kibana: (VI tool) Explore, Visualize and Share, eliminating the need for complex SQL query execution
- Beats: Data shipper.
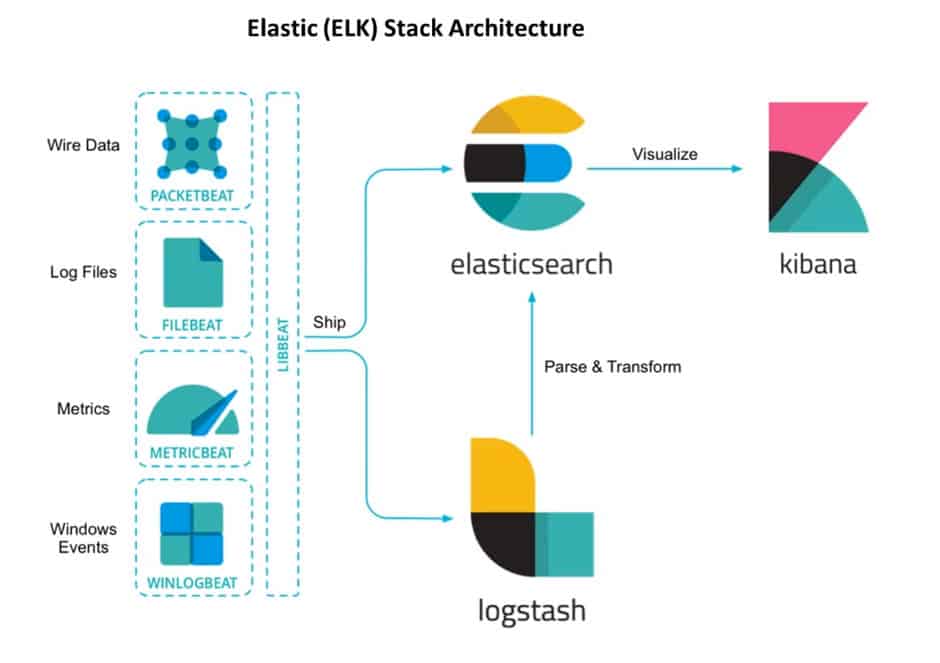
Beats(agent) collects the logs and send data to logstash, logstash will do filter, parse and transform into meaning full data and store it into elasticsearch and then make it available in a fast and reliable way and Kibana uses a powerful analytical tool to summarize the data across many dimensions.
ELK Stack Architecture Elasticsearch Logstash and Kibana
 Let’s see how data is passed through different components:
Beats: is a data shipper which collects the data at the client and ship it either to elasticsearch or logstash
Elasticsearch is an HA and distributed search engine
- Built on top of Apache Lucene (it itself is a powerful search engine, all the power of Lucene easily expose to simple configuration and plugins, it handles human language synonyms, typo mistake)
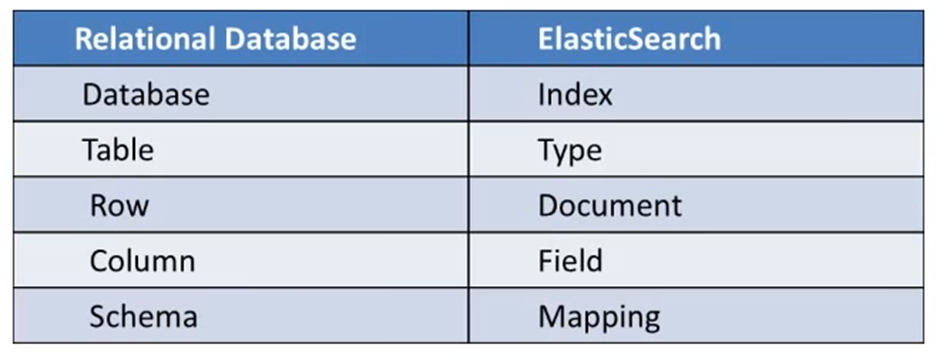
- NoSQL Datastore (like MongoDB)
- Schema-free (no need to define a schema before adding data into elasticsearch)
- JSON Document (data in elasticsearch is stored in form of JSON document)
- RESTful APIs (Elasticsearch has powerful RESTful APIs that you can interact with cluster)
- Node
- Cluster
Elasticsearch RESTfull API: 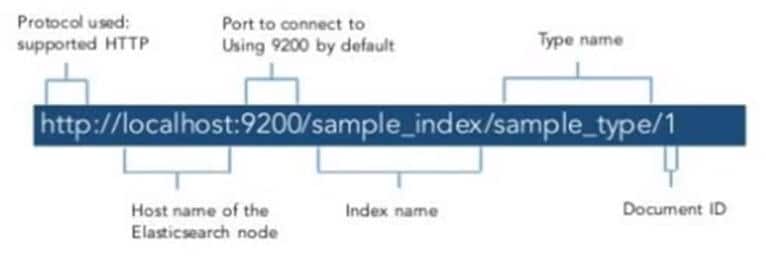
[ads1]
How to query and interact with elasticsearch, elasticsearch provide compressive and powerful RESTful API’s that you can interact with your cluster, along with this we can add with following API’s: HTTP Based CRUD Operations:
| Operation | CURL Command |
| Create | curl -XPUT “http://localhost:9200//type/” |
| Read | curl -XGET “http://localhost:9200//type/” |
| Update | curl -XPOST “http://localhost:9200//type/” |
| Delete | curl -XDELETE “http://localhost:9200//type/” |
ElasticSearch: Elasticsearch is distributed, which means that indices can be divided into shards and each shard can have zero or more replicas. By default, an index is created with 5 shards and 1 replica per shard (5/1). Rebalancing and routing of shards are done automatically. Features:
- Distributed
- Scalable
- Highly available
- Near Real Time (NRT) search
- Full-Text Search
- Java, .NET, PHP, Python, Curl, Perl, Ruby
- HADOOP & SPARK – Elasticsearch-Hadoop (ES-Hadoop)
Case study: Challenge: How do you satisfy the search needs of GitHub’s 4 million users while simultaneously providing tactical operational insights that help you iteratively improve customer service?
Solutions: Github uses Elasticsearch to continually index the data from an ever-growing store of over 8million code repositories, comparing over 2 billion documents. GitHub uses elasticsearch to index new code as soon as users push it to a repository on GitHub. Other customers include Facebook, Netflix, eBay, Wikimedia, etc., eBay: Searching across 800 million listings in sub-seconds.
Logstash: it can collect logs from a variety of sources (using input plugins), process the data into a common format using filters, and stream data to a variety of source (using output plugins). Multiple filters can be chained to parse the data into a common format. Together, they build a Logstash Processing Pipeline. 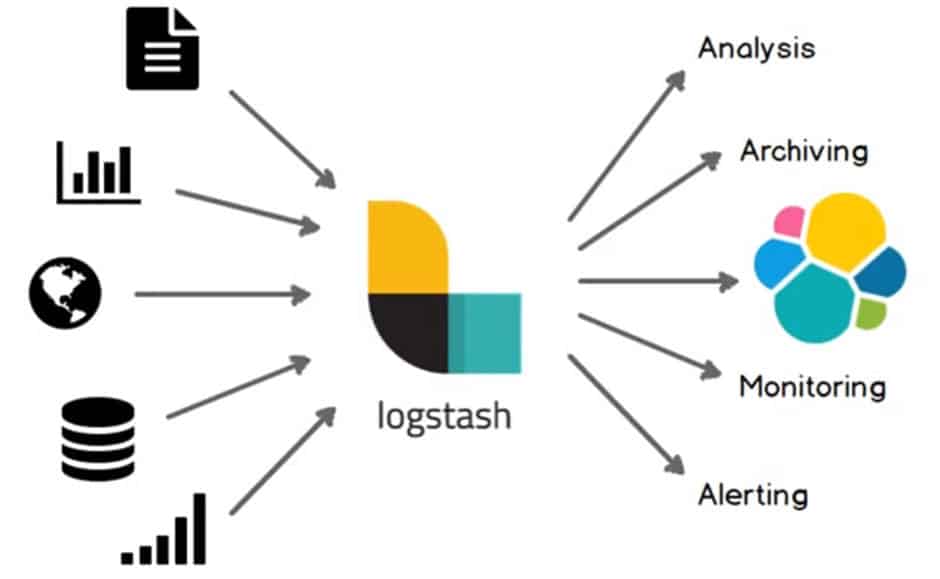 Logstash welcome data from all shapes and size of data. Eg: syslogs, datastore like NoSQL/RDBMS, web-like Twitter or Github. Logstash will transform the data and store it into different storage for analytical. Example:
- For analysis, we can use datastore like MongoDB or elasticsearch
- For archiving we can store data in the s3/Google storage
- For monitoring, we can use Nagios/Graphite
For alerting we can use Slack/Email/HipChat Logstash Plug-ins: Logstash has a rich collection of input, filter and output plugins. You can create your own logstash plugin and it into community plugins.
| Input Plugins | Filter Plugins | Output Plugins |
| Beats | Aggregate | CSV |
| Elasticsearch | CSV | Elasticsearch |
| Kafka | Date | |
| Graphite | geoip | File |
| Heartbeat | grok | Graphite |
| Tttp | Json | Http |
| JDBC | sleep | Jira |
| File | urlencode | Kafka |
| Log4j | UUID | Nagios |
| Redis | xml | Redis |
| Stdin | Stdout | |
| TCP | S3 | |
| TCP | ||
| UDP |
Input Plugins: Enables a specific source of the event to be read by logstash
Filter Plugins: to perform intermediate processing of an event
Output Plugins: We can send data to different destination
Logstash pipeline: Basic configuration syntax of the logstash pipeline
input { … }

filter { … }

output { … }
Logstash conf file contains input & output element and the optional element is filter. The Input plugin consumes the data from the source and the filter plugin modifies the data as you specify and an output plugin will write the data to the destination.
Eg:
[ads1]
[root@SKS-ELK conf.d]# vim /etc/logstash/conf.d/10-syslog.conf
# The # character at the beginning of a line indicates a comment. Use
# comments to describe your configuration.
input {
beats {
port => "5044" #On this port filebeat send log form service box
} .
}
# The filter part of this file is commented out to indicate that it is
# optional.
filter {
grok{ #grok is the filter plugin which parse unstructured log data into something structured and queryable
patterns_dir => ["/etc/logstash/patterns"] #here we mention the format for filter
match => {
"message" => "{LOG_TIME:logtime}" #mention what you want to filter from log
}
}
}
output {
#stdout { codec => rubydebug }
#file {
It is very simple a browser-based interface that you can quickly create and share dynamic dashboard that simply changes your elastic query into realtime.
Kibana: It is also an opensource analytical and visualization platform and it is designed to work with Elasticsearch. It gives you the freedom to select the way you give shape to your data.
We can use search, view, interact the datastore into elasticsearch indices. You can easily perform advanced data analysis and visualize your data in a verity of charts, table, and maps and it also makes it easy to understand large volume of data.
- Discover
- Visualize
- Dashboards
- Put Geo Data on any map
- Insert dashboards into your internal wiki or webpage
- Send your co-worker a URL to a dashboard.
Betas: It is a lightweight data shipper. Beats is the platform for single-purpose data shippers. They install as lightweight agents and send data (different operational data) from hundreds or thousands of machines to logstash or Elasticsearch.
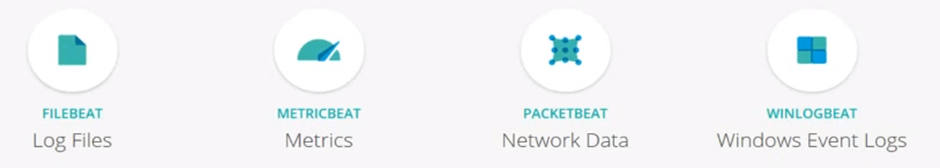
FileBeat: is used to ship logs from the server
Packetbeat: is the network packet analyzer that ship the information about the transaction exchange within your application server.
MetricBeat: is a server monitoring agent that collects the metrics from the Operating System and services of your server.
WinlogBeats: ship the windows log events.
This is the end of ELK tutorial, we explained ELK Stack Architecture Elasticsearch Logstash and Kibana.
[divider style=”normal” top=”20″ bottom=”20″]
Read Other Articles
Top 10 Open Source Tools Every Developer should know