In this tutorial, we’ll explain the steps to install and configure Filebeat on Linux. I’ve been using Filebeat over the last few years. Filebeat tool is one of the lightweight log/data shipper or forwarder.
Filebeat is used to ship/forward your application logs from one server (client-server) to a central log server.
Elasticsearch is one of the options to forward logs from client to central log server and Elasticsearch is Opensource. An alternate option you can also use Splunk but it is too costly as per my opinion.
[ads1]
Filebeat support for below environment to ship/forward logs:
- System – local logs
- Nginx
- MySQL
- Tomcat
- Elasticsearch
- Apache
- Apache2
- HAProxy
- Auditd
- Nagios
- MongoDB
- Kibana
- Kafka
- Icinga
- IPtables
- Logstash
- PostgreSQL
- Redis
- And many more…
Let’s see how to setup Filebeat on Linux system 64-bit Amazon Linux:
[ads2]
Step 1: Download Filebeat
Download Filebeat for LINUX 64-BIT:
curl -L -O https://artifacts.elastic.co/downloads/beats/filebeat/filebeat-7.6.2-linux-x86_64.tar.gz

tar -xzvf filebeat-7.6.2-linux-x86_64.tar.gz

cd filebeat-7.6.2-linux-x86_64
[box type=”note” align=”” class=”” width=””]While creating this blog the latest Filebeat version was “filebeat-7.6.2-linux-x86_64.tar.gz”. To download the latest version goto official Filebeat download page[/box]
Demo output for easy understanding:
[ec2-user@application-server filebeat-7.6.2-linux-x86_64]$ pwd

/home/ec2-user/filebeat-7.6.2-linux-x86_64

[ec2-user@application-server filebeat-7.6.2-linux-x86_64]$

[ec2-user@application-server filebeat-7.6.2-linux-x86_64]$ ls -ltra

total 76696

-rw-r--r--  1 ec2-user ec2-user    13675 Mar 26 04:44 LICENSE.txt

-rw-r--r--  1 ec2-user ec2-user   328580 Mar 26 04:44 NOTICE.txt

drwxr-xr-x  3 ec2-user ec2-user       15 Mar 26 05:23 kibana

-rw-------  1 ec2-user ec2-user     8333 Mar 26 05:23 filebeat.yml

-rw-r--r--  1 ec2-user ec2-user    89359 Mar 26 05:23 filebeat.reference.yml

-rw-r--r--  1 ec2-user ec2-user   500235 Mar 26 05:23 fields.yml

drwxr-xr-x 39 ec2-user ec2-user     4096 Mar 26 05:23 module

drwxr-xr-x  2 ec2-user ec2-user     4096 Mar 26 05:23 modules.d

-rwxr-xr-x  1 ec2-user ec2-user 77562560 Mar 26 05:25 filebeat

-rw-r--r--  1 ec2-user ec2-user      802 Mar 26 05:26 README.md

-rw-r--r--  1 ec2-user ec2-user       41 Mar 26 05:26 .build_hash.txt

drwx------  5 ec2-user ec2-user      263 Apr 6 11:39 ..

drwxrwxr-x  5 ec2-user ec2-user      212 Apr 6 11:39 .

[ec2-user@application-server filebeat-7.6.2-linux-x86_64]$
Download Filebeat for MAC:
curl -L -O https://artifacts.elastic.co/downloads/beats/filebeat/filebeat-7.6.2-darwin-x86_64.tar.gz

tar xzvf filebeat-7.6.2-darwin-x86_64.tar.gz
Download Filebeat RPM Package:
curl -L -O https://artifacts.elastic.co/downloads/beats/filebeat/filebeat-7.6.2-x86_64.rpm

sudo rpm -vi filebeat-7.6.2-x86_64.rpm
Download and Install Filebeat with YUM Package Manager:
-
Download and install the public signing key:
sudo rpm --import https://packages.elastic.co/GPG-KEY-elasticsearch
-
Create file filebeat.repo
vi /etc/yum.repos.d/filebeat.repo
[elastic-7.x]
name=Elastic repository for 7.x packages
baseurl=https://artifacts.elastic.co/packages/7.x/yum
gpgcheck=1
gpgkey=https://artifacts.elastic.co/GPG-KEY-elasticsearch
enabled=1
autorefresh=1
type=rpm-md
-
Yum command to install Filebeat on Linux
sudo yum install filebeat
-
Enable Filebeat service
sudo systemctl enable filebeat
(OR)
[ads3]
If you are not using systemd then follow the below command to update run level for Filebeat service.
sudo chkconfig --add filebeat
Step 2: Configure filebeat.yml file
Sample filebeat.yml file — This below filebeat.yml file by default will be created when you installed filebeat on your Linux system.
[ec2-user@application-server filebeat-7.6.2-linux-x86_64]$ cat filebeat.yml
###################### Filebeat Configuration Example #########################
# This file is an example configuration file highlighting only the most common
# options. The filebeat.reference.yml file from the same directory contains all the
# supported options with more comments. You can use it as a reference.
#
# You can find the full configuration reference here:
# https://www.elastic.co/guide/en/beats/filebeat/index.html
# For more available modules and options, please see the filebeat.reference.yml sample
# configuration file.
#=========================== Filebeat inputs =============================
filebeat.inputs:
# Each - is an input. Most options can be set at the input level, so
# you can use different inputs for various configurations.
# Below are the input specific configurations.
- type: log
# Change to true to enable this input configuration.
enabled: false
# Paths that should be crawled and fetched. Glob based paths.
paths:
- /var/log/*.log
#- c:\programdata\elasticsearch\logs\*
# Exclude lines. A list of regular expressions to match. It drops the lines that are
# matching any regular expression from the list.
#exclude_lines: ['^DBG']
# Include lines. A list of regular expressions to match. It exports the lines that are
# matching any regular expression from the list.
#include_lines: ['^ERR', '^WARN']
# Exclude files. A list of regular expressions to match. Filebeat drops the files that
# are matching any regular expression from the list. By default, no files are dropped.
#exclude_files: ['.gz$']
# Optional additional fields. These fields can be freely picked
# to add additional information to the crawled log files for filtering
#fields:
# level: debug
# review: 1
### Multiline options
# Multiline can be used for log messages spanning multiple lines. This is common
# for Java Stack Traces or C-Line Continuation
# The regexp Pattern that has to be matched. The example pattern matches all lines starting with [
#multiline.pattern: ^\[
# Defines if the pattern set under pattern should be negated or not. Default is false.
#multiline.negate: false
# Match can be set to "after" or "before". It is used to define if lines should be append to a pattern
# that was (not) matched before or after or as long as a pattern is not matched based on negate.
# Note: After is the equivalent to previous and before is the equivalent to to next in Logstash
#multiline.match: after
#============================= Filebeat modules ===============================
filebeat.config.modules:
# Glob pattern for configuration loading
path: ${path.config}/modules.d/*.yml
# Set to true to enable config reloading
reload.enabled: false
# Period on which files under path should be checked for changes
#reload.period: 10s
#==================== Elasticsearch template setting ==========================
setup.template.settings:
index.number_of_shards: 1
#index.codec: best_compression
#_source.enabled: false
#================================ General =====================================
# The name of the shipper that publishes the network data. It can be used to group
# all the transactions sent by a single shipper in the web interface.
#name:
# The tags of the shipper are included in their own field with each
# transaction published.
#tags: ["service-X", "web-tier"]
# Optional fields that you can specify to add additional information to the
# output.
#fields:
# env: staging
#============================== Dashboards =====================================
# These settings control loading the sample dashboards to the Kibana index. Loading
# the dashboards is disabled by default and can be enabled either by setting the
# options here or by using the `setup` command.
#setup.dashboards.enabled: false
# The URL from where to download the dashboards archive. By default this URL
# has a value which is computed based on the Beat name and version. For released
# versions, this URL points to the dashboard archive on the artifacts.elastic.co
# website.
#setup.dashboards.url:
#============================== Kibana =====================================
# Starting with Beats version 6.0.0, the dashboards are loaded via the Kibana API.
# This requires a Kibana endpoint configuration.
setup.kibana:
# Kibana Host
# Scheme and port can be left out and will be set to the default (http and 5601)
# In case you specify and additional path, the scheme is required: http://localhost:5601/path
# IPv6 addresses should always be defined as: https://[2001:db8::1]:5601
#host: "localhost:5601"
# Kibana Space ID
# ID of the Kibana Space into which the dashboards should be loaded. By default,
# the Default Space will be used.
#space.id:
#============================= Elastic Cloud ==================================
# These settings simplify using Filebeat with the Elastic Cloud (https://cloud.elastic.co/).
# The cloud.id setting overwrites the `output.elasticsearch.hosts` and
# `setup.kibana.host` options.
# You can find the `cloud.id` in the Elastic Cloud web UI.
#cloud.id:
# The cloud.auth setting overwrites the `output.elasticsearch.username` and
# `output.elasticsearch.password` settings. The format is `<user>:<pass>`.
#cloud.auth:
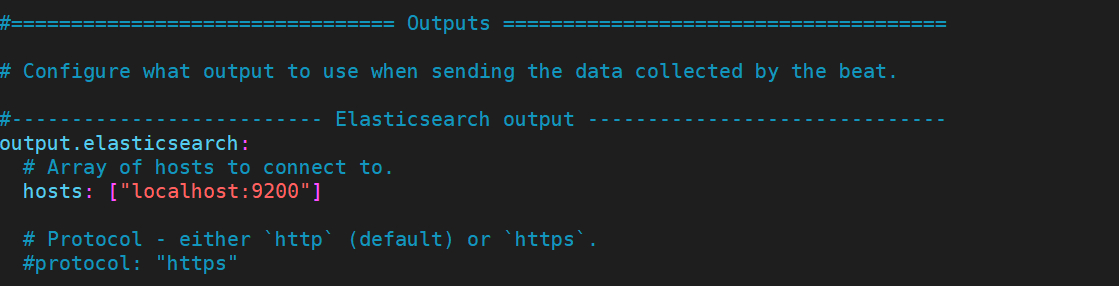
#================================ Outputs =====================================
# Configure what output to use when sending the data collected by the beat.
#-------------------------- Elasticsearch output ------------------------------
output.elasticsearch:
# Array of hosts to connect to.
hosts: ["localhost:9200"]
# Protocol - either `http` (default) or `https`.
#protocol: "https"
# Authentication credentials - either API key or username/password.
#api_key: "id:api_key"
#username: "elastic"
#password: "changeme"
#----------------------------- Logstash output --------------------------------
#output.logstash:
# The Logstash hosts
#hosts: ["localhost:5044"]
# Optional SSL. By default is off.
# List of root certificates for HTTPS server verifications
#ssl.certificate_authorities: ["/etc/pki/root/ca.pem"]
# Certificate for SSL client authentication
#ssl.certificate: "/etc/pki/client/cert.pem"
# Client Certificate Key
#ssl.key: "/etc/pki/client/cert.key"
#================================ Processors =====================================
# Configure processors to enhance or manipulate events generated by the beat.
processors:
- add_host_metadata: ~
- add_cloud_metadata: ~
- add_docker_metadata: ~
- add_kubernetes_metadata: ~
#================================ Logging =====================================
# Sets log level. The default log level is info.
# Available log levels are: error, warning, info, debug
#logging.level: debug
# At debug level, you can selectively enable logging only for some components.
# To enable all selectors use ["*"]. Examples of other selectors are "beat",
# "publish", "service".
#logging.selectors: ["*"]
#============================== X-Pack Monitoring ===============================
# filebeat can export internal metrics to a central Elasticsearch monitoring
# cluster. This requires xpack monitoring to be enabled in Elasticsearch. The
# reporting is disabled by default.
# Set to true to enable the monitoring reporter.
#monitoring.enabled: false
# Sets the UUID of the Elasticsearch cluster under which monitoring data for this
# Filebeat instance will appear in the Stack Monitoring UI. If output.elasticsearch
# is enabled, the UUID is derived from the Elasticsearch cluster referenced by output.elasticsearch.
#monitoring.cluster_uuid:
# Uncomment to send the metrics to Elasticsearch. Most settings from the
# Elasticsearch output are accepted here as well.
# Note that the settings should point to your Elasticsearch *monitoring* cluster.
# Any setting that is not set is automatically inherited from the Elasticsearch
# output configuration, so if you have the Elasticsearch output configured such
# that it is pointing to your Elasticsearch monitoring cluster, you can simply
# uncomment the following line.
#monitoring.elasticsearch:
#================================= Migration ==================================
# This allows to enable 6.7 migration aliases
#migration.6_to_7.enabled: true
[ec2-user@application-server filebeat-7.6.2-linux-x86_64]$
Update the filebeat.yml file and configure it.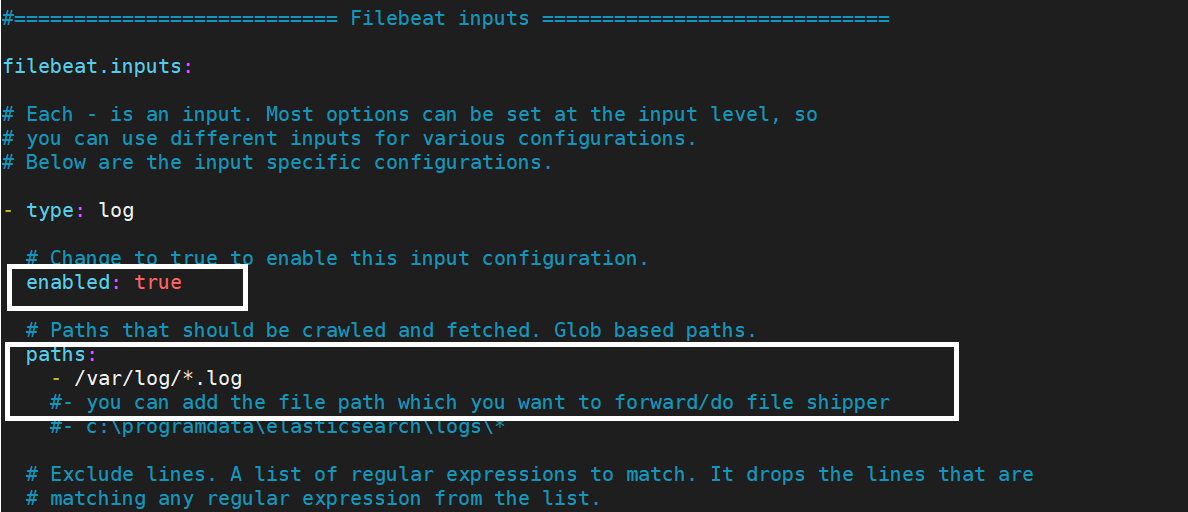
Step 3: Enable and forward logs to Elasticsearch server
Edit filebeat.yml file and add Elasticsearch IP address, If you are running Elasticsearch on the same system then you need to add localhost in filebeat.yml file. Make sure Elasticsearch is running on localhost.
Step 4: Update filebeat.yml file ownership
[ads2]
[ec2-user@application-server filebeat-7.6.2-linux-x86_64]$ sudo chown root filebeat.yml

[ec2-user@application-server filebeat-7.6.2-linux-x86_64]$ ll filebeat.yml

-rw------- 1 root ec2-user 8408 Apr  6 11:52 filebeat.yml

[ec2-user@application-server filebeat-7.6.2-linux-x86_64]$
Step 5: Run Filebeat service on Linux system
sudo ./filebeat -e
This is the end of the tutorial, we have seen Steps to install and configure Filebeat on Linux.
[divider style=”normal” top=”20″ bottom=”20″]
Thanks for reading this article, you’ll like below articles.