In this tutorial, we’ll explain steps to monitor Linux server using Prometheus node exporter. Before starting with the steps, let’s understand about node exporter.
What is a Node Exporter?
It is used to collect all the hardware and kernel-related metrics or in simple definition collect statistics and Linux server related metrics for monitoring.
Prerequisites to monitor Linux server in Prometheus:
- To monitor Linux hosts you first need Prometheus Server UP & running. then only Node exporter will work.
- Need to open Port 9100 at Server firewall, If Linux server hosted on AWS EC2 Cloud then you would need to open port at the Security group of your ec2 instance.
[ads1]
Steps to Monitor Linux Server using Prometheus – Node Exporter
Step 1: Download the latest node exporter package.
Official Download Page: https://prometheus.io/download/#node_exporter
As per the latest binary file, update the below command. While creating this blog latest binary available was “node_exporter-0.18.1.linux-amd64.tar.gz”
cd /tmp

curl -LO https://github.com/prometheus/node_exporter/releases/download/v0.18.1/node_exporter-0.18.1.linux-amd64.tar.gz
Step 2: Extract the download node_exporter tarball
tar xvfz node_exporter-*.*-amd64.tar.gz
Step 3: Move the node export binary file to /usr/local/bin
sudo mv node_exporter-0.18.1.linux-amd64/node_exporter /usr/local/bin/
Sample Demo Output:
[ec2-user@Node-Exporter tmp]$ ls -l /usr/local/bin/node_exporter
-rwxr-xr-x 1 ec2-user ec2-user 16878582 Jun  4  2019 /usr/local/bin/node_exporter
[ec2-user@Node-Exporter tmp]$
[ads2]
[divider style=”normal” top=”20″ bottom=”20″]
Step to Create a Custom Node Exporter Service
Step 1: Create a node_exporter user
This user will be used to run the node exporter service
sudo useradd -rs /bin/false node_exporter
Step 2: Create a node_exporter service file
sudo vi /etc/systemd/system/node_exporter.service
Step 3: Copy the following content to the service file
cat /etc/systemd/system/node_exporter.service
[Unit]

Description=Node Exporter

After=network.target


[Service]

User=node_exporter

Group=node_exporter

Type=simple

ExecStart=/usr/local/bin/node_exporter


[Install]

WantedBy=multi-user.target
Step 4: Start the node exporter service
sudo systemctl daemon-reload

sudo systemctl start node_exporter
Step 5: Command to check the node exporter status
sudo systemctl status node_exporter
Step 6: Enable the node exporter service run on the system startup
sudo systemctl enable node_exporter
Verify the server metrics by visiting your server URL on “/metrics” as shown below.
[ads3]
http://<server-IP>:9100/metrics
[divider style=”normal” top=”20″ bottom=”20″]
Configure the Linux Server as Target on Prometheus Server
Till now we setup and configure node exporter and node exporter service is up and running, now let’s add this Linux server as a target on the Prometheus server.
Step 1: SSH Login to Prometheus server
ssh prometheus-server-ip
Step 2: Edit the prometheus.yml file
sudo vi /etc/prometheus/prometheus.yml
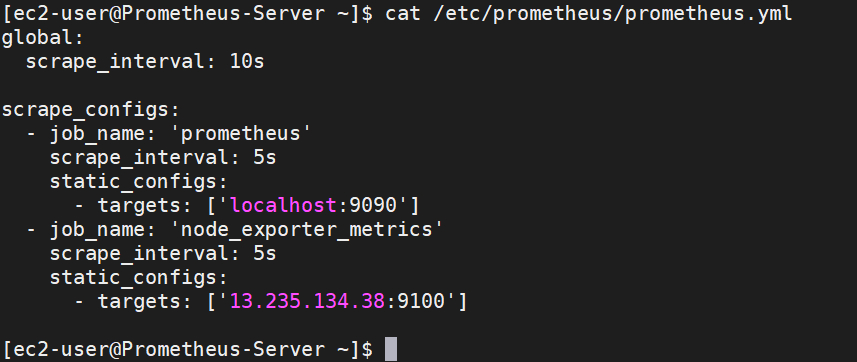
Step 3: You need to add the below content in the scrape config section.
- job_name: 'node_exporter_metrics'

    scrape_interval: 5s

    static_configs:

      - targets: ['your-target-server-ip:9100']
Sample Demo Output
[ads1]
[box type=”note” align=”” class=”” width=””]Change ‘your-target-server-ip:9100’ to your server IP where you configured node exporter. Job name can be your hostname or ip-address; this is just for identifying your server.[/box]
Step 3: Once you have updated file then, Restart the Prometheus service
[ads2]
sudo systemctl restart prometheus
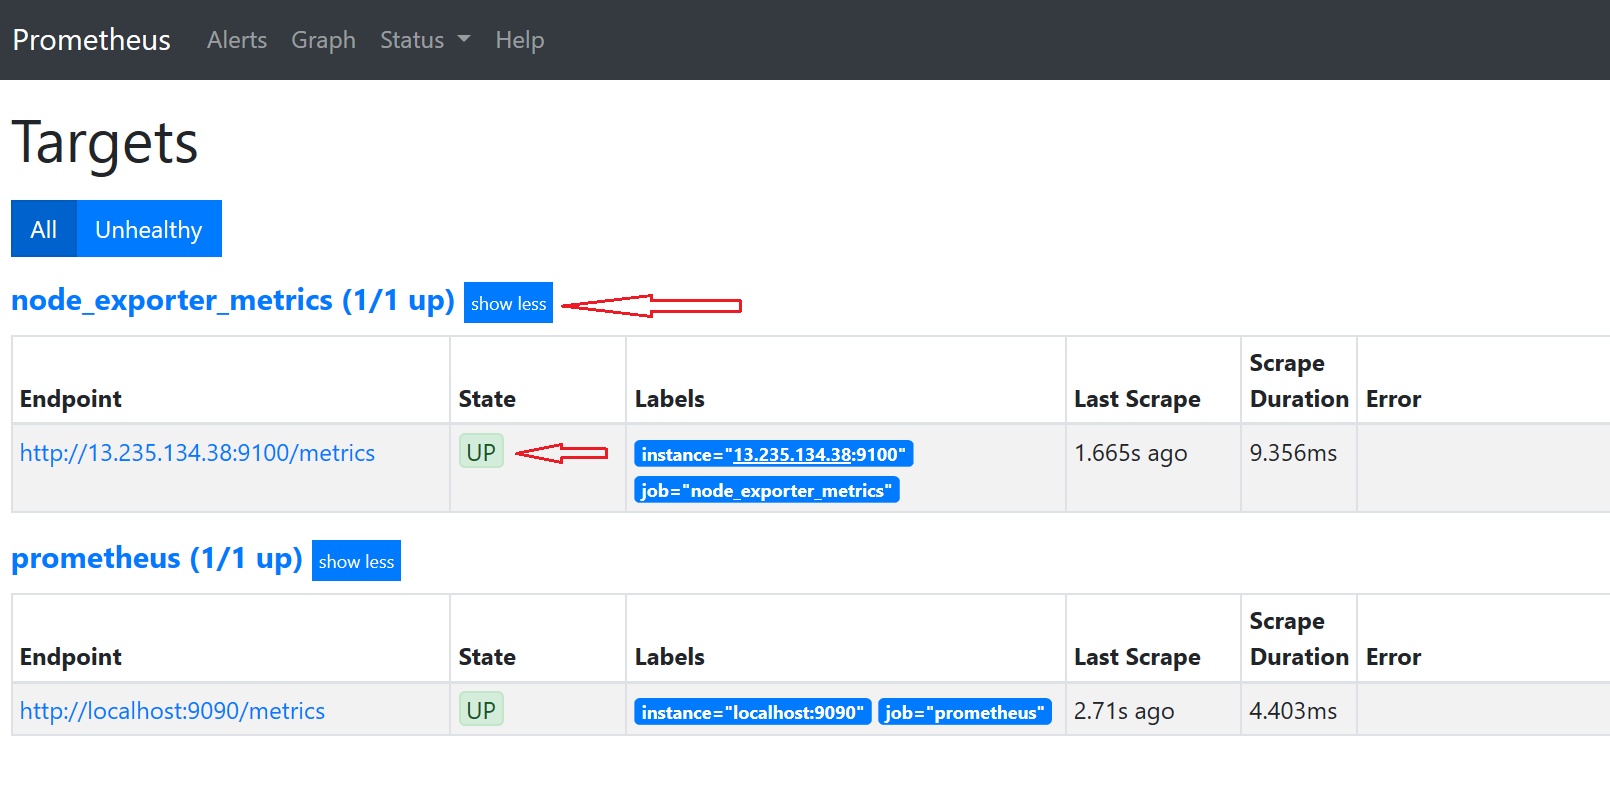
Now check your Prometheus web UI, you will see the target Linux server as shown in the below screenshot.
http://<prometheus-IP>:9090/targets
Learn more about Prometheus by referring to its documentation.
In this tutorial, we have seen the steps to monitor Linux server using Prometheus.
[divider style=”normal” top=”20″ bottom=”20″]
[ads4]
You’ll like these below articles
Steps To Install and Configure Prometheus On a Linux Server
Steps to connect Linux Server from windows using Putty
How to Mount S3 Bucket on Linux Instance
Basic Linux Storage Scenario #4
How to execute script or command on reboot or startup in Linux


