In this article, we’ll see how to monitor Ubuntu performance using Netdata. Netdata is an open-source real-time monitoring Linux server. Netdata collects thousands of metrics from Linux, systems, containers, applications, and hardware.
As a system administrator or developer, monitoring the performance of your Ubuntu server is critical to ensure optimal server performance and availability. With the right monitoring tools, you can easily identify potential issues and proactively take corrective action before they become major problems.
Netdata is a powerful and lightweight monitoring tool that provides real-time performance monitoring of your Ubuntu system. In this blog, we will guide you through the steps of installing Netdata and configuring it to monitor Ubuntu performance.
What is Netdata?
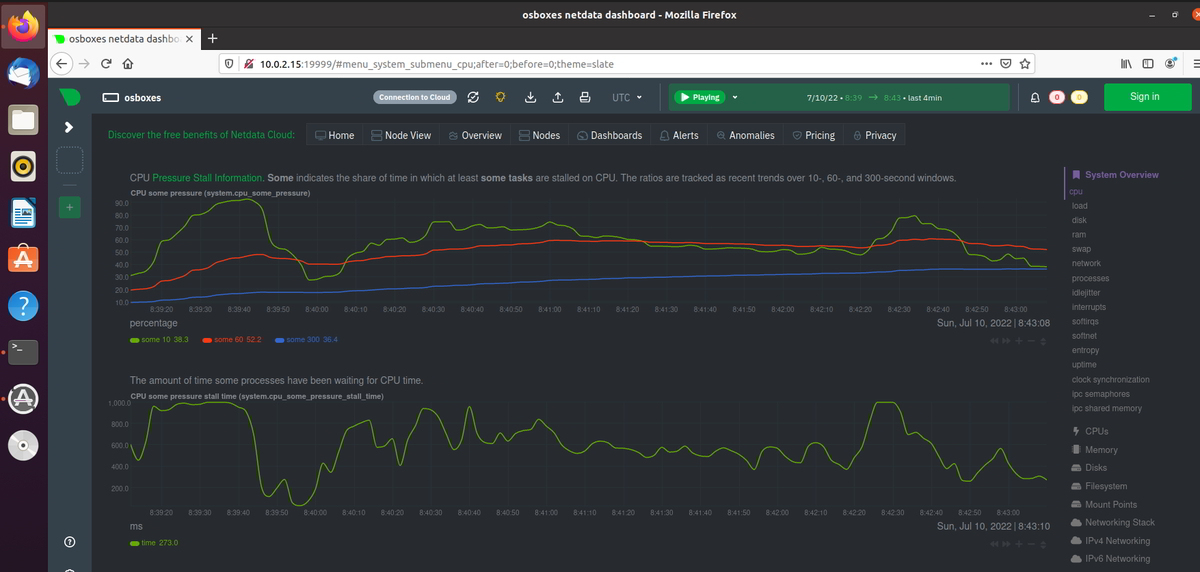
Netdata is an open-source, real-time performance monitoring tool that can be used to monitor various aspects of your Ubuntu server’s performance, including CPU usage, memory usage, network traffic, disk usage, and more. Netdata is designed to be easy to install and use, with a web-based dashboard that provides real-time performance metrics and alerts.
Netdata supports a wide range of Linux distributions, including Ubuntu, Debian, CentOS, Fedora, and more. It is designed to be lightweight and low overhead, so it won’t consume valuable system resources while monitoring your system’s performance.
Steps to Install Netdata on the Ubuntu Server
There are 2 ways to install Netdata one is by cloning the Netdata git repository and executing the script and the other option is to run an automated script on the shell
In this blog, we will see how to install Netdata via automated script on a shell and this will be a simple and easy way to install Netdata.
Step 1: Download and run the Automated script to install Netdata
$ bash <(curl -Ss https://my-netdata.io/kickstart.sh)
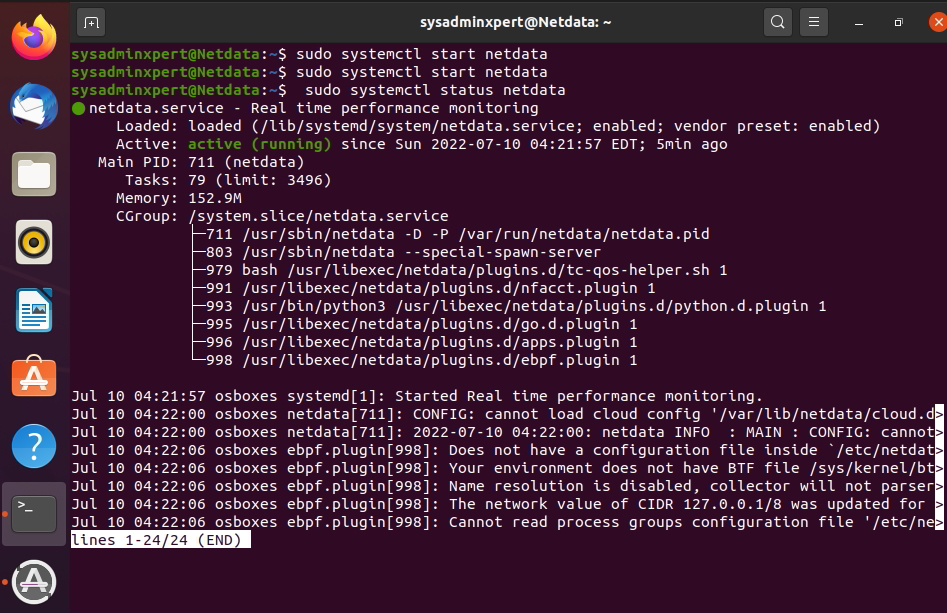
Step 2: Command to start, enable and verify the Netdata service on Ubuntu
$ sudo systemctl start netdata

$ sudo systemctl enable netdata

$ sudo systemctl status netdata
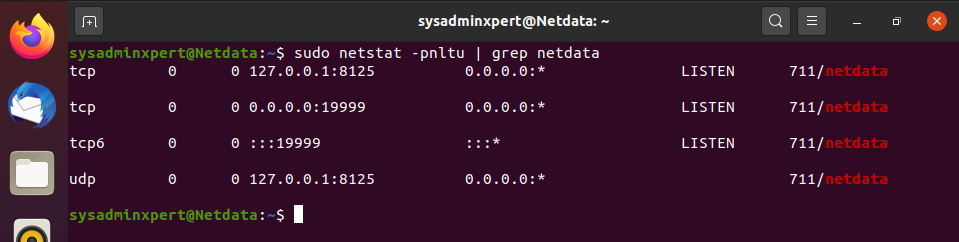
Step 3: Verify Netdata port
Netdata listens on port 19999, verify with the below command
$ sudo netstat -pnltu | grep netdata
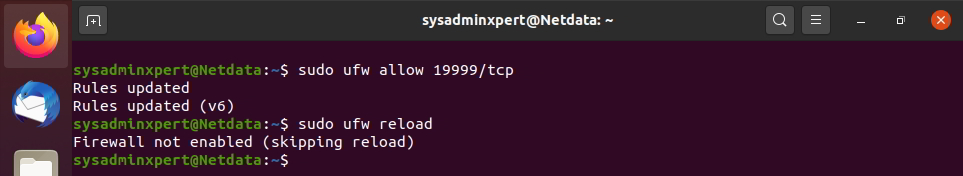
Step 4: Configure Firewall to allow Netdata port
$ sudo ufw allow 19999/tcp

$ sudo ufw reload
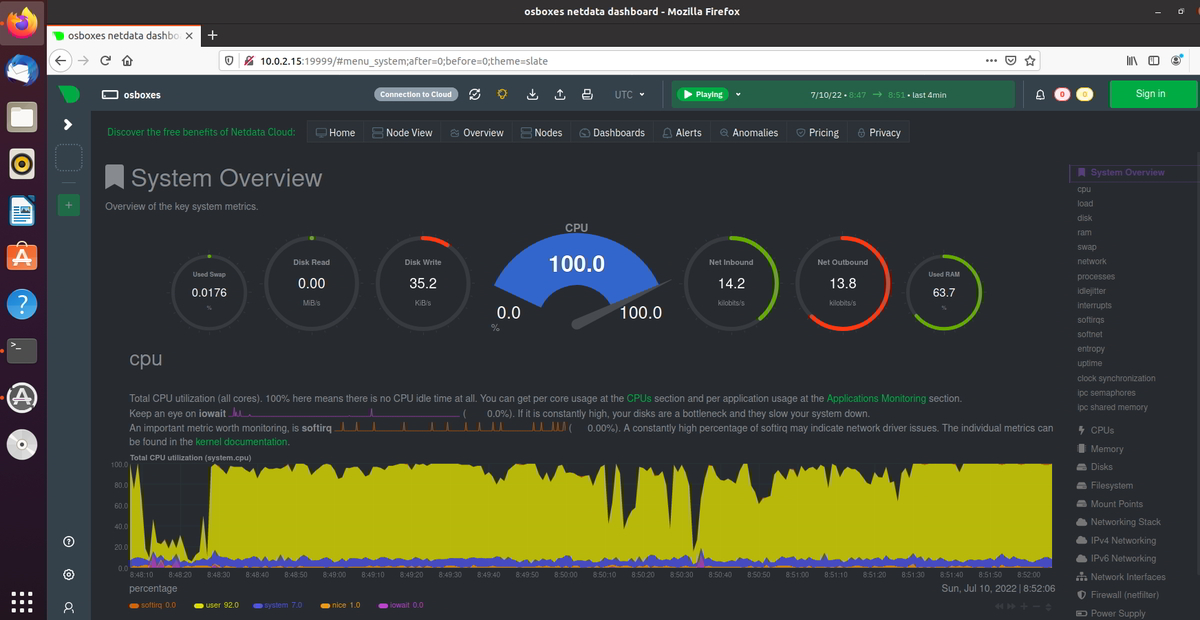
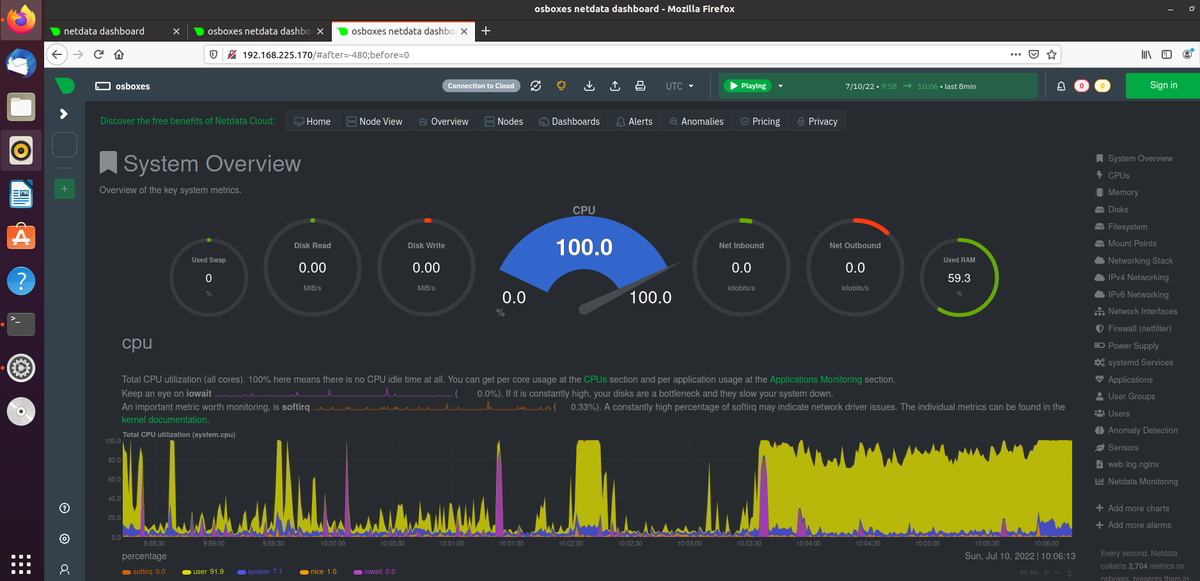
Step 5: Access Netdata on the browser
Step to Secure Netdata with Basic Authentication on Ubuntu
Here we will configure basic HTTP authentication, for this we need to install the package and provide htpasswd. Nginx is also required which will act as a reverse proxy.
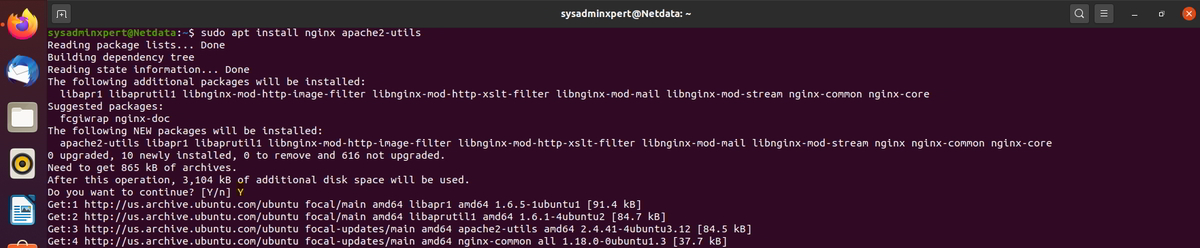
Step 1: Install the Nginx web server and apache2-utils package
$ sudo apt install nginx apache2-utils
Step 2: Configure Nginx
We will configure Nginx to proxy incoming requests for the Netdata dashboard.
$ sudo vim /etc/nginx/conf.d/default.conf
replace the server_ip and example.com directives with your own server IP address and server name
upstream netdata-backend {
server 127.0.0.1:19999;
keepalive 64;
}

server {
listen server_ip:80;
server_name example.com;

auth_basic "Authentication Required";
auth_basic_user_file netdata-access;

location / {
proxy_set_header X-Forwarded-Host $host;
proxy_set_header X-Forwarded-Server $host;
proxy_set_header X-Forwarded-For $proxy_add_x_forwarded_for;
proxy_pass http://netdata-backend;
proxy_http_version 1.1;
proxy_pass_request_headers on;
proxy_set_header Connection "keep-alive";
proxy_store off;
}
}
In my case I configured as mentioned below:
upstream netdata-backend {
server 127.0.0.1:19999;
keepalive 64;
}

server {
listen 192.168.225.170:80;
server_name netdata.sysadminxpert.com;

auth_basic "Authentication Required";
auth_basic_user_file /etc/nginx/netdata-access;

location / {
proxy_set_header X-Forwarded-Host $host;
proxy_set_header X-Forwarded-Server $host;
proxy_set_header X-Forwarded-For $proxy_add_x_forwarded_for;
proxy_pass http://netdata-backend;
proxy_http_version 1.1;
proxy_pass_request_headers on;
proxy_set_header Connection "keep-alive";
proxy_store off;
}
}
Test Nginx config:
sysadminxpert@Netdata:~$ sudo nginx -t
nginx: the configuration file /etc/nginx/nginx.conf syntax is ok
nginx: configuration file /etc/nginx/nginx.conf test is successful

sysadminxpert@Netdata:~$
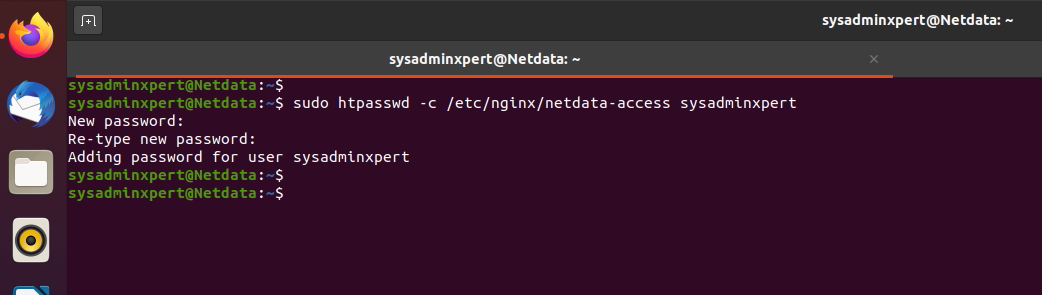
Step 3: Create a username and password using htpasswd tool
$ sudo htpasswd -c /etc/nginx/netdata-access sysadminxpert
Step 4: Restart the Nginx service
$ sudo systemctl restart nginx
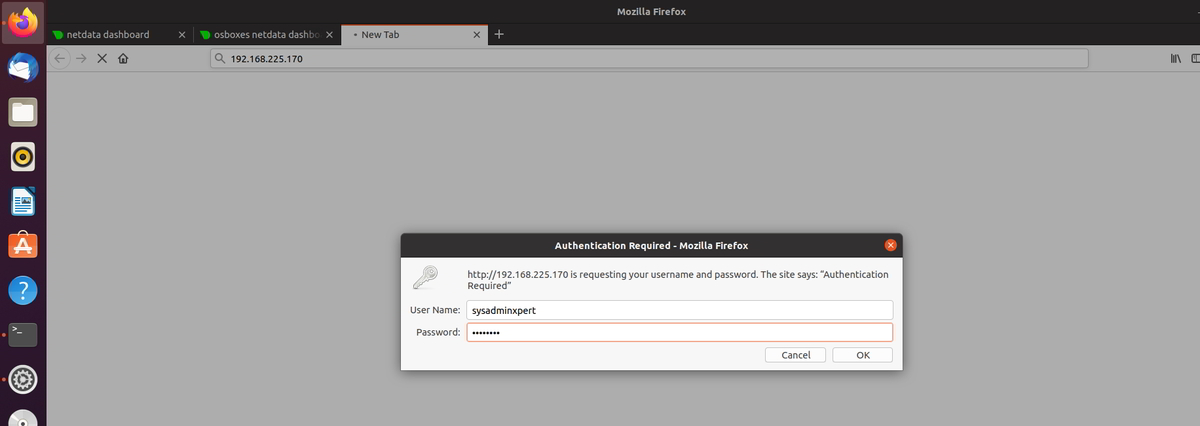
Step 5: Access Netdata on the browser
To test the configuration and access Netdata it should ask for a username and password.
Conclusion
Netdata is a powerful and easy-to-use tool for monitoring Ubuntu performance in real time. With Netdata, you can quickly identify performance issues and take corrective action before they become major problems. By following the steps outlined in this guide, you can easily install and configure Netdata for Ubuntu performance monitoring, customize the monitoring settings to suit your specific needs, and use the web dashboard to view performance metrics and alerts.
FAQ’s
Q: What is the advantage of using Netdata for Ubuntu performance monitoring?
A: Netdata is a lightweight and low-overhead monitoring tool that provides real-time performance metrics and alerts for Ubuntu systems. With Netdata, you can quickly identify performance issues and take corrective action before they become major problems. Netdata is also easy to install and use, with a web-based dashboard that provides a comprehensive view of system performance.
Q: Can Netdata be used to monitor other Linux distributions besides Ubuntu?
A: Yes, Netdata can be used to monitor a wide range of Linux distributions, including Debian, CentOS, Fedora, and more.
Q: What kind of metrics can Netdata monitor?
A: Netdata can monitor various system metrics, including CPU usage, memory usage, disk usage, network traffic, and more. Netdata also supports plugins for monitoring specific applications or services, such as Apache, MySQL, and more.
Q: Can Netdata be customized for specific monitoring needs?
A: Yes, Netdata can be customized to suit specific monitoring needs. You can change the web dashboard port, configure alerts, enable additional plugins, and customize the Netdata dashboard to display specific metrics or charts.
Q: Is Netdata open source?
A: Yes, Netdata is open source and available under the GPLv3 license.
Q: How can Netdata help in troubleshooting performance issues?
A: Netdata provides real-time performance metrics and alerts, which can help in troubleshooting performance issues. With Netdata, you can identify the root cause of performance issues by analyzing the metrics and charts. Netdata also supports exporting metrics to other tools such as Prometheus, which can help in long-term performance analysis.
Q: Is it possible to secure the Netdata dashboard with a password?
A: Yes, it is possible to secure the Netdata dashboard with a password. You can enable password authentication by adding the following lines to the netdata.conf file:
[web]
# enable password authentication
password = mypassword
After making the changes, restart Netdata:
sudo systemctl restart netdata
Q: Can Netdata be used to monitor containers and virtual machines?
A: Yes, Netdata can be used to monitor containers and virtual machines. Netdata supports plugins for popular container platforms such as Docker, Kubernetes, and more. Netdata also supports the monitoring of virtual machines using plugins for KVM, QEMU, and more.
End of article. we have seen how to monitor Ubuntu performance using Netdata.